


Monthly
To get started, no commitment.
€59/ month
Billed €59 every month
Tools included in the subscription
Education
The Journal records your trades from MT5 and cTrader and turns them into 30+ statistics, equity curve and calendar. It also tracks emotions and discipline, because numbers alone aren't enough.
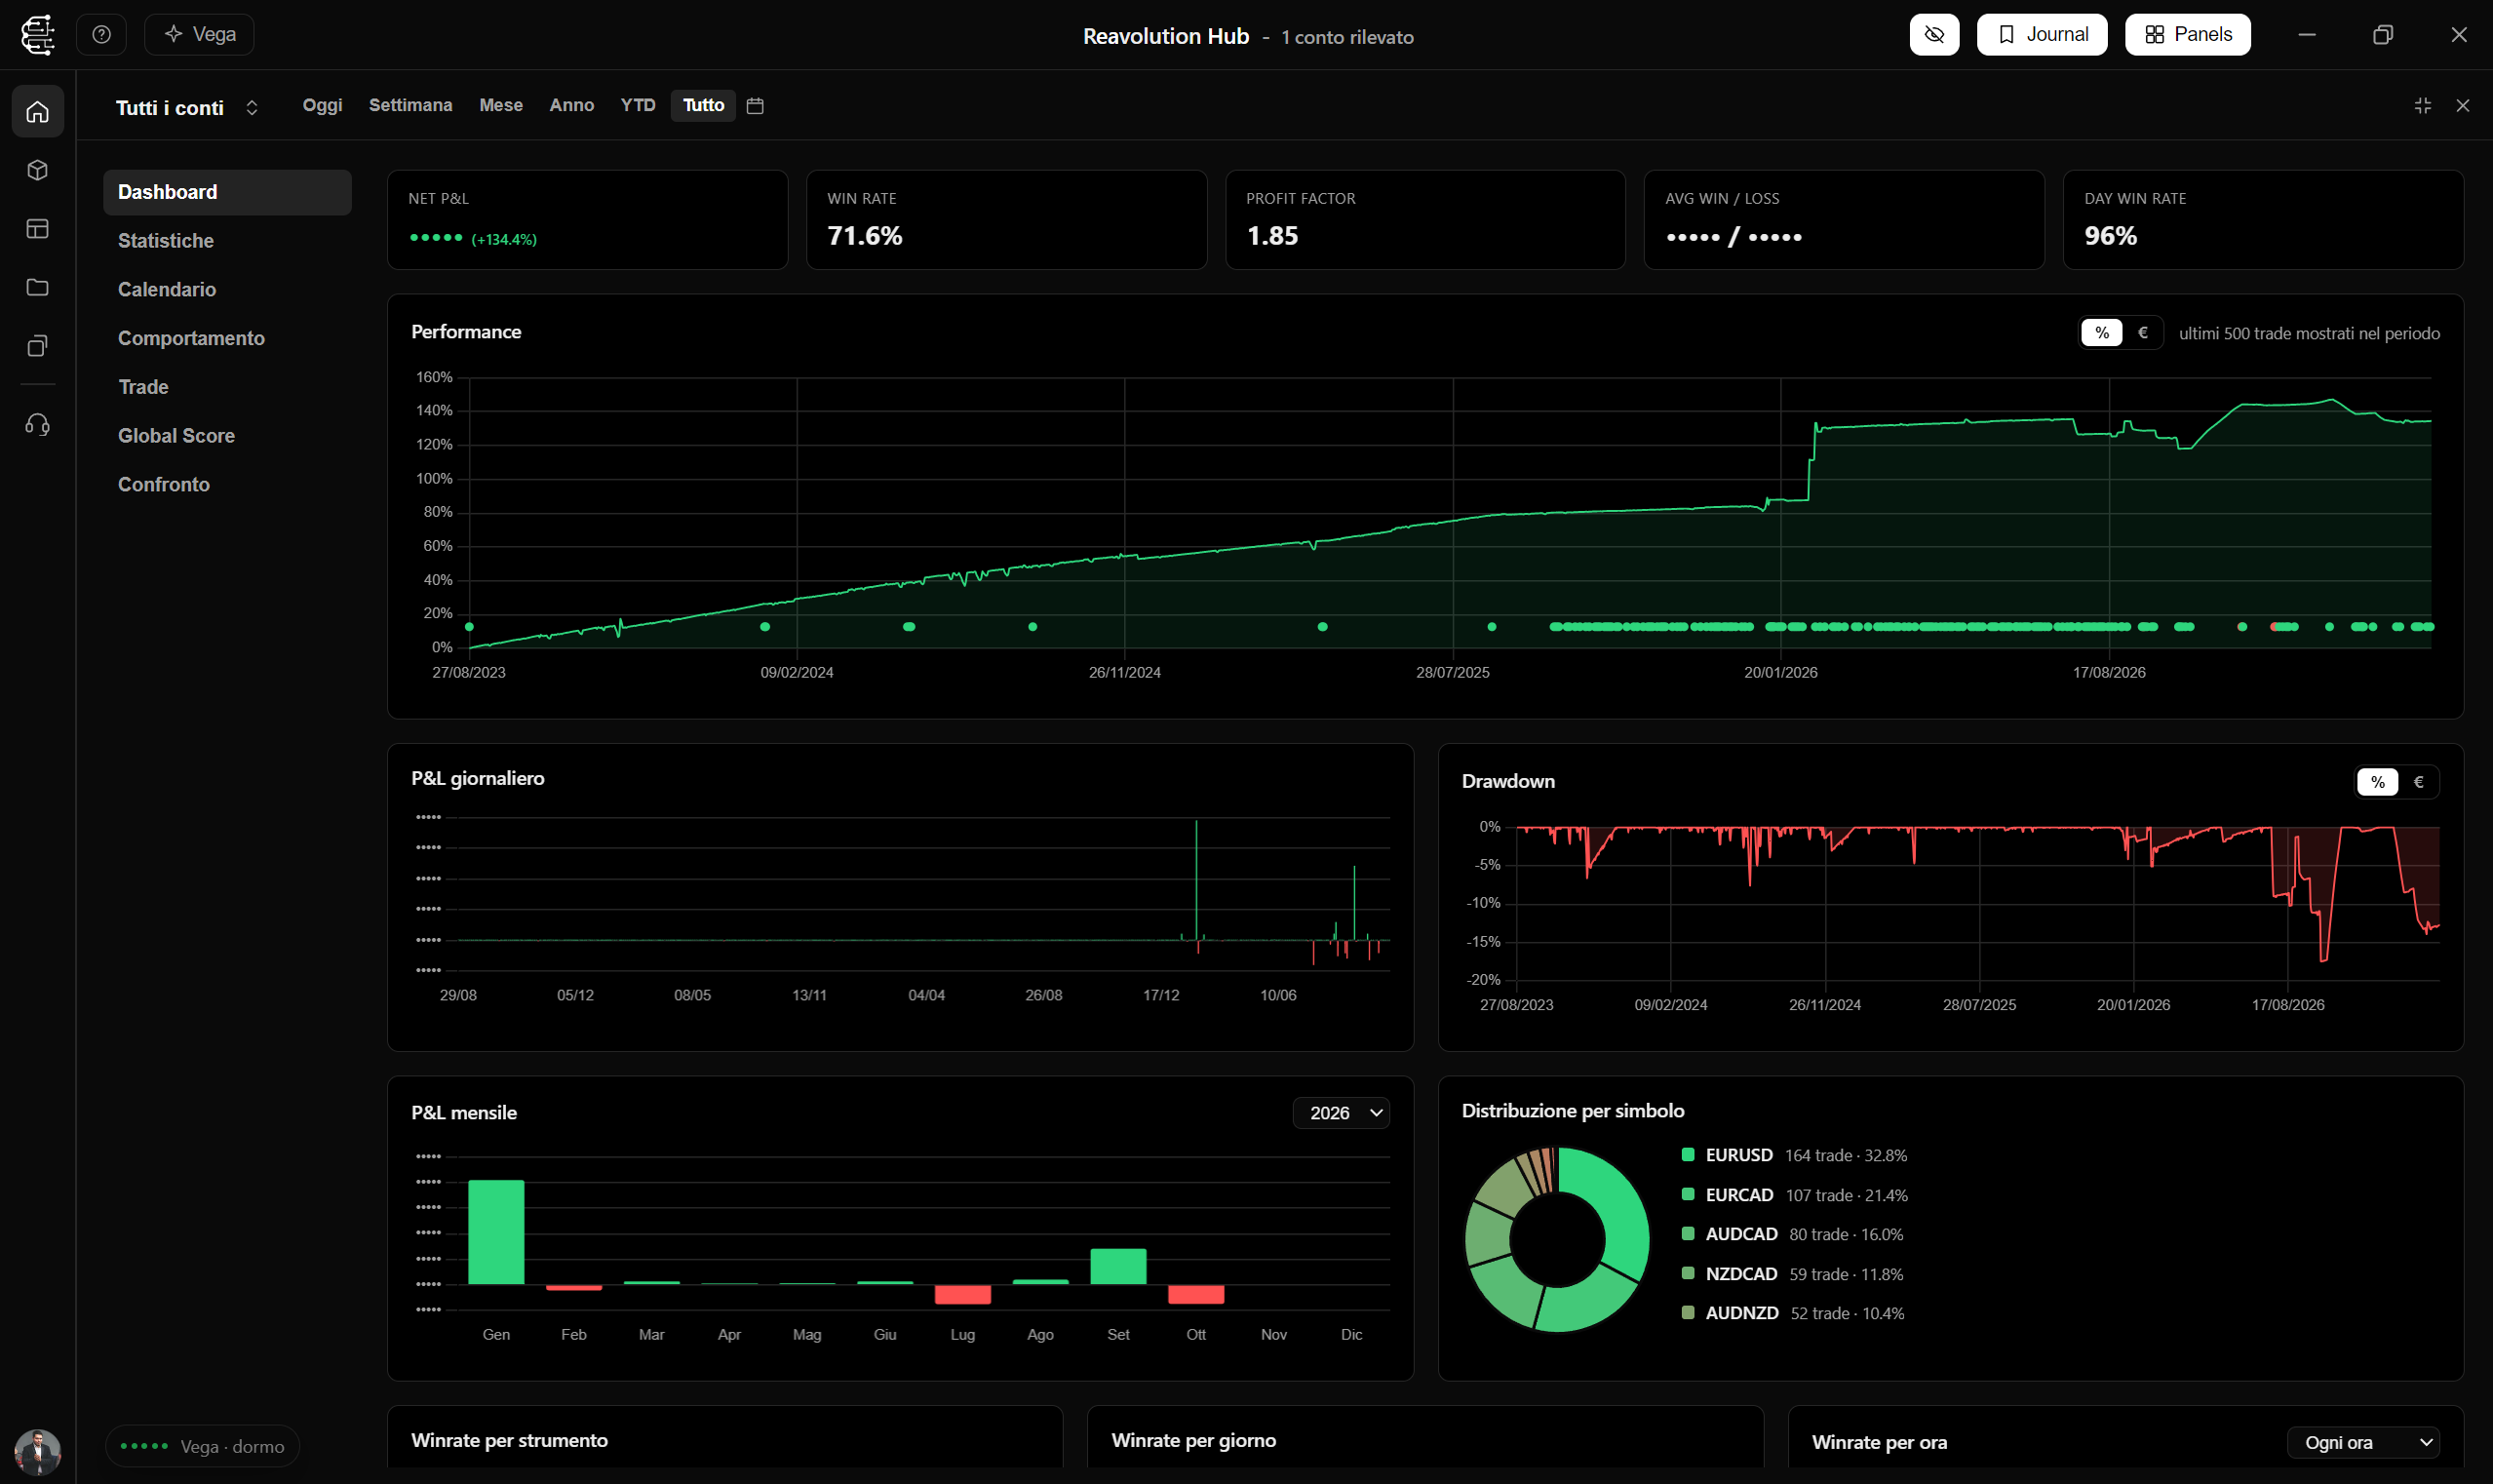
A visual and numerical overview of your performance: the equity curve shows how your capital evolves over time, with zoom and filters.
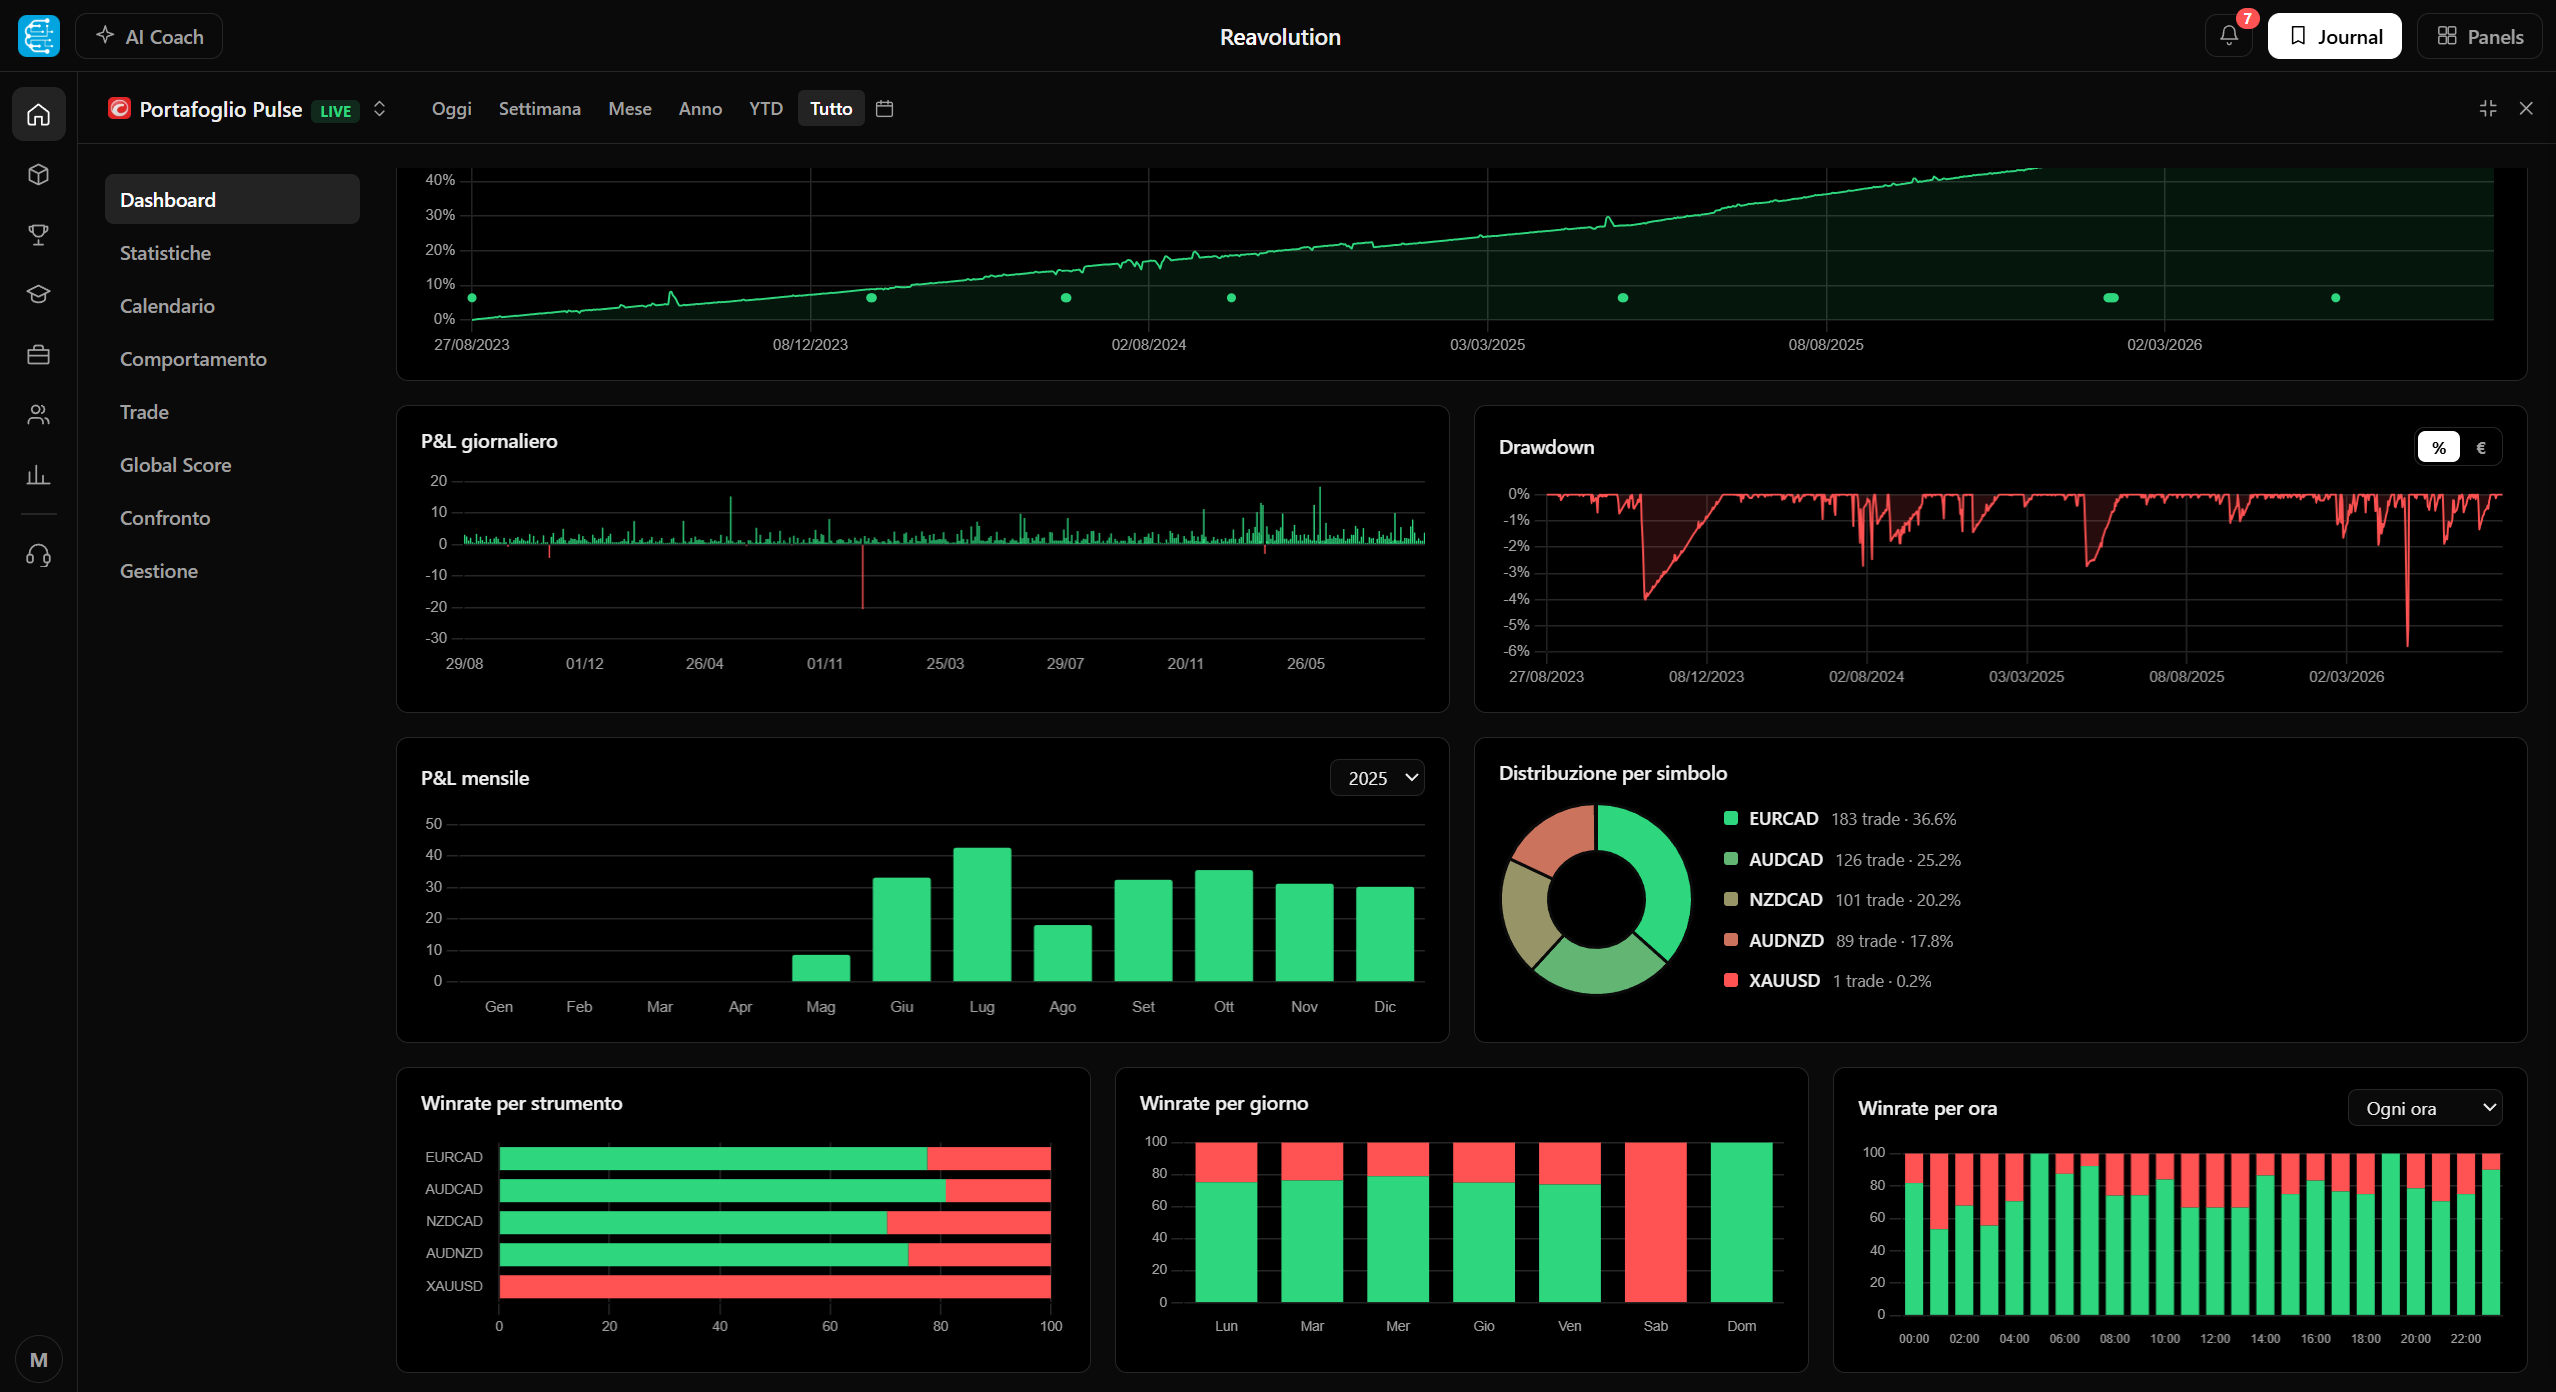
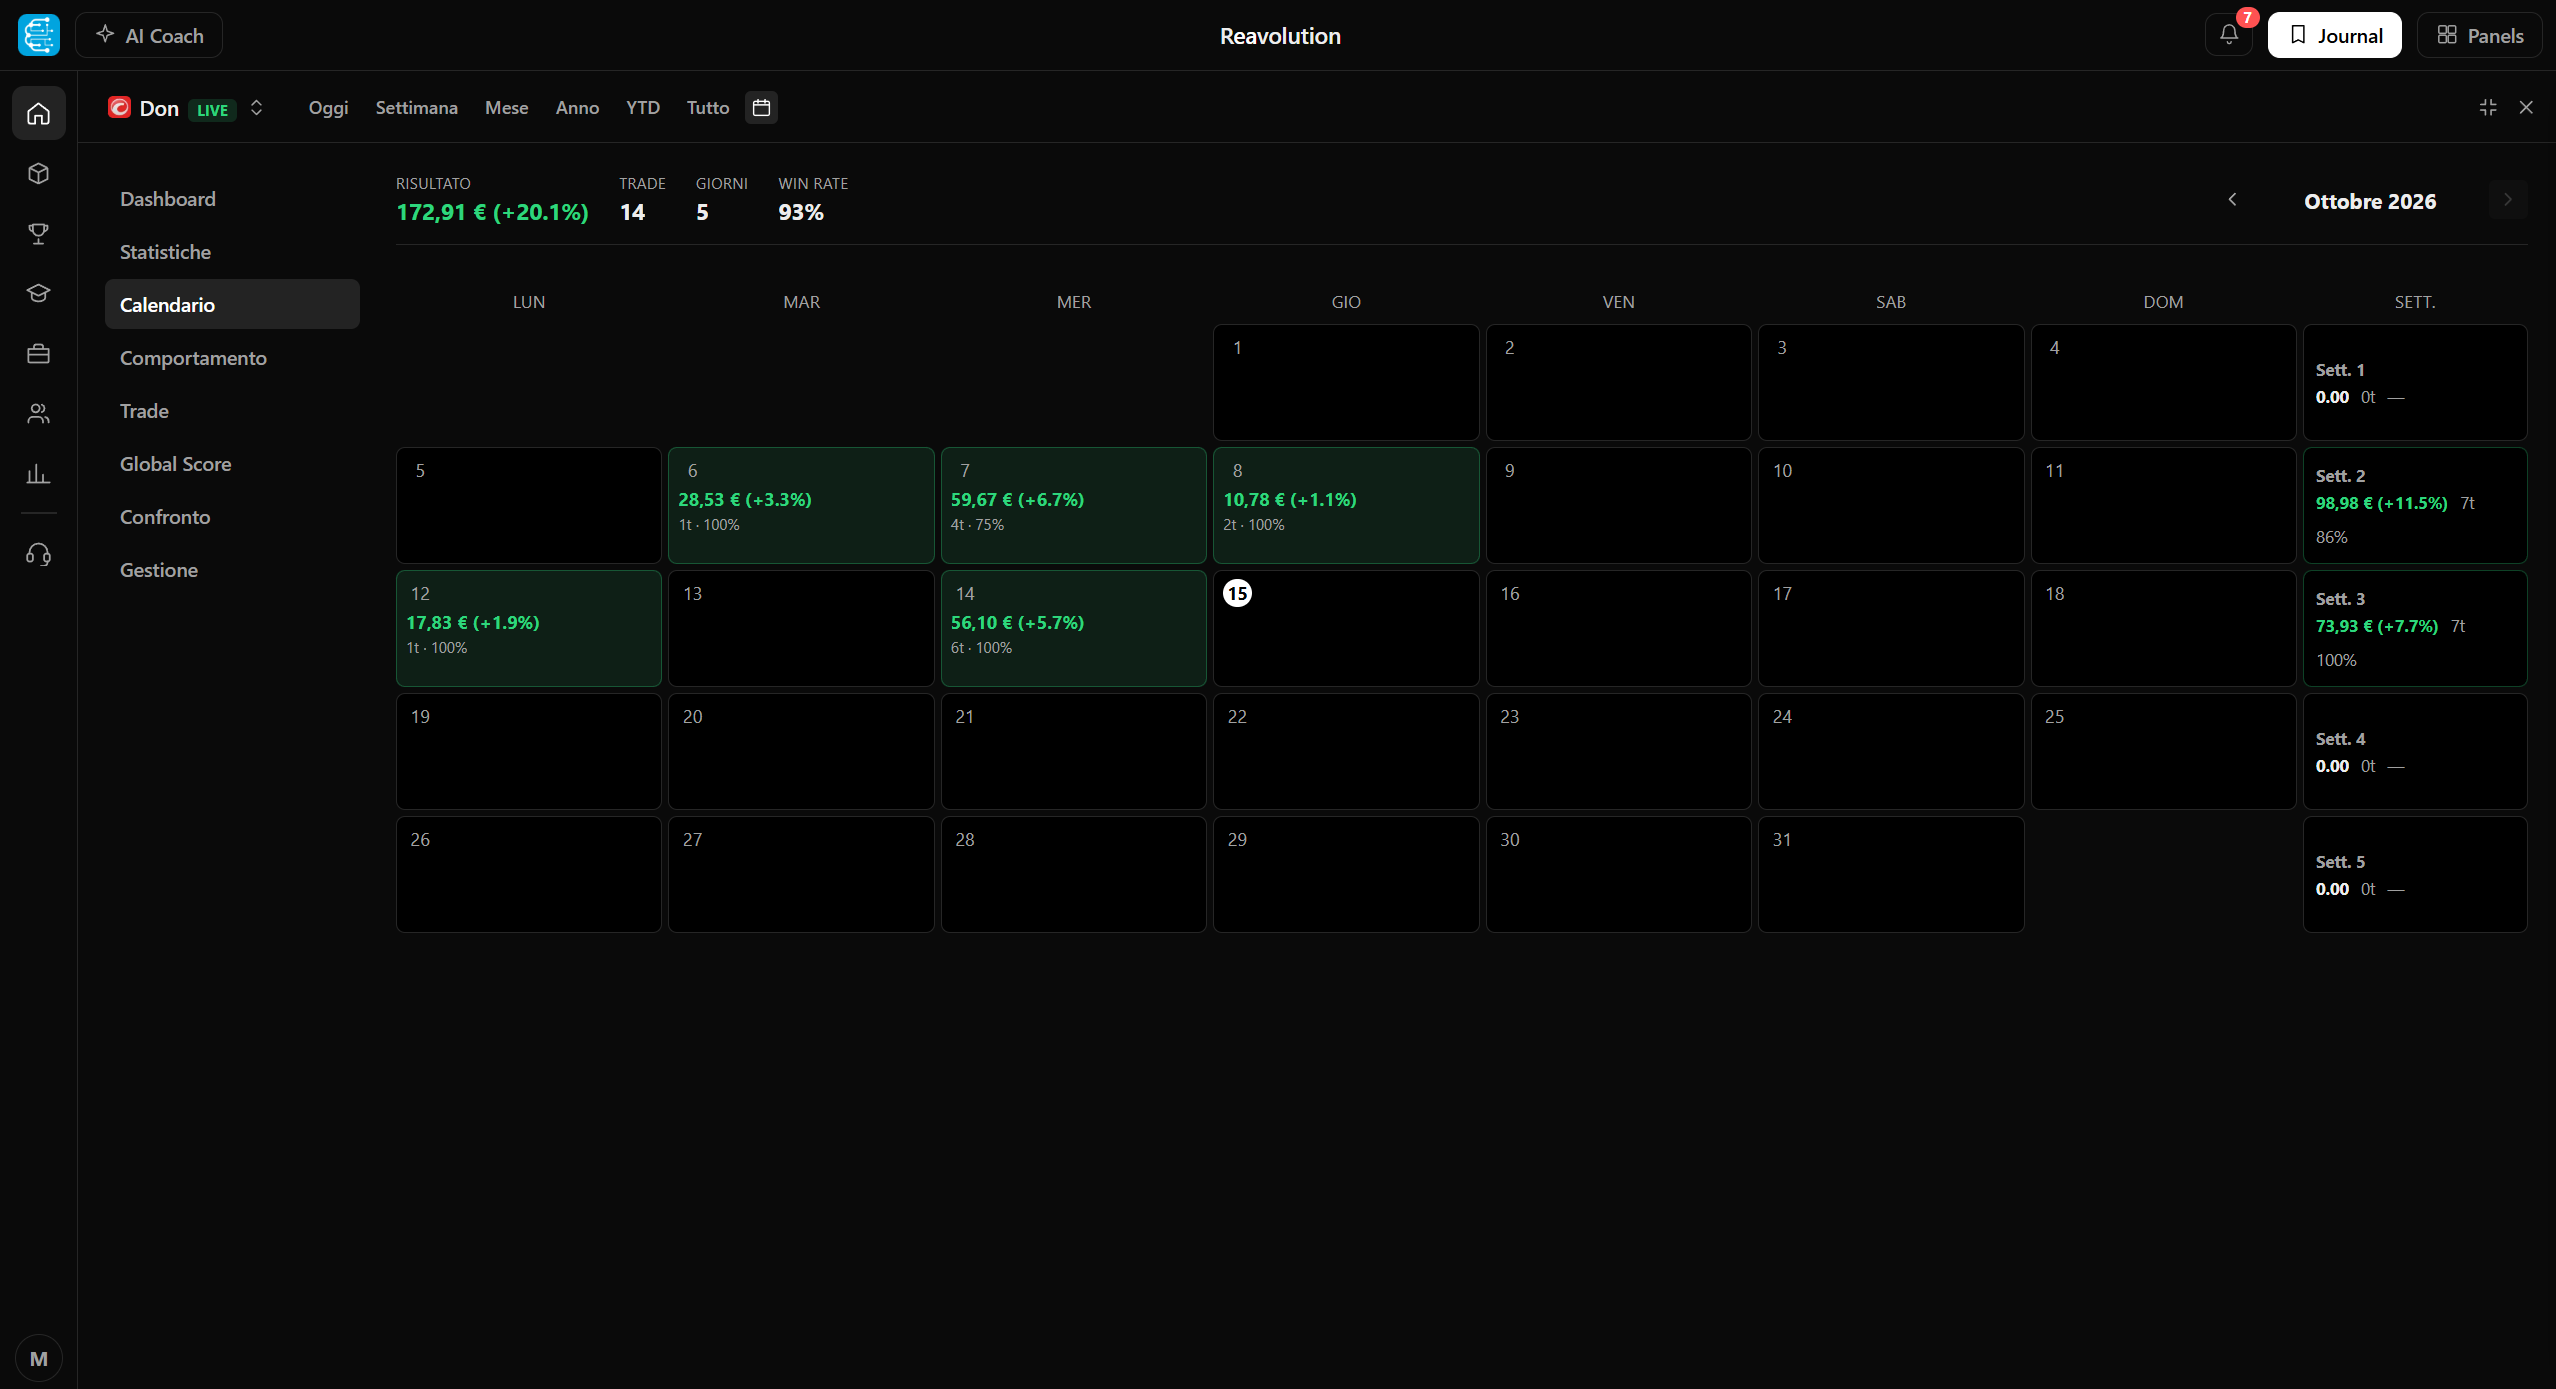
For each day you see profits, losses and number of trades: understand at a glance when you trade best and where mistakes concentrate.
Record your emotional state before, during and after each trade and track your rules checklist. The Journal links emotions and performance to help you build discipline.
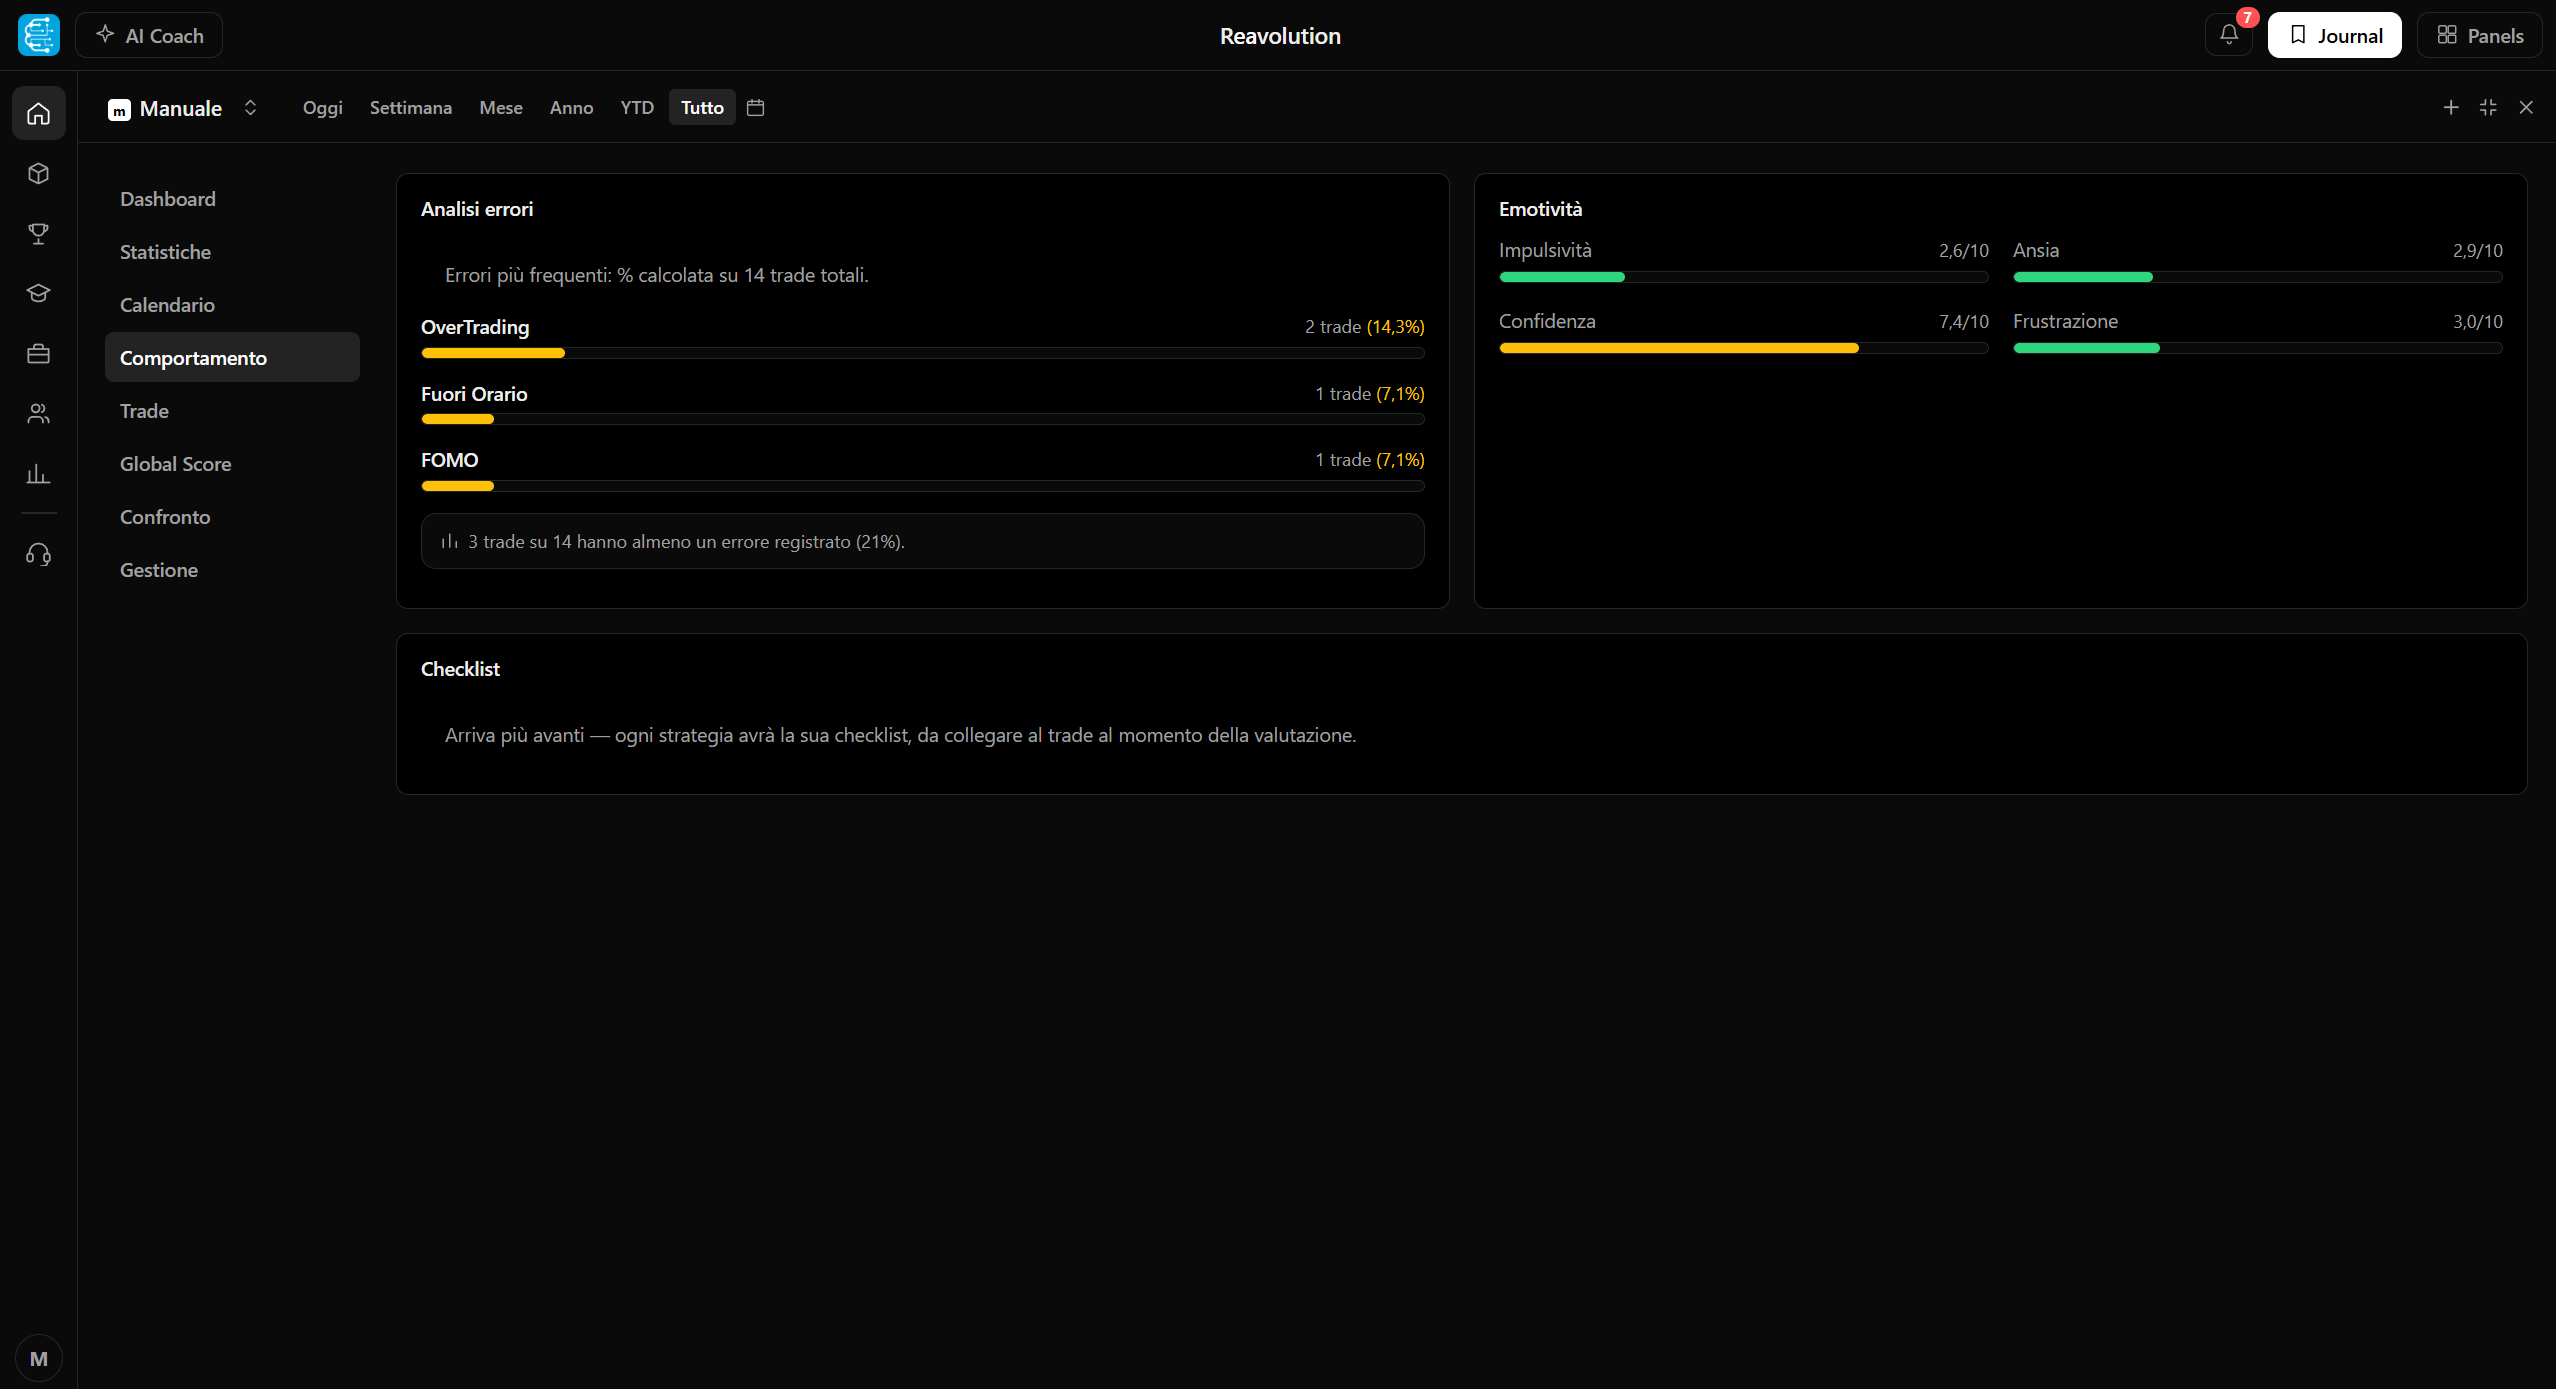
Download the .xlsx file from cTrader or MT5 and upload it to the Journal: in seconds you have statistics and charts ready. Or connect your account directly, including from the Windows Hub.
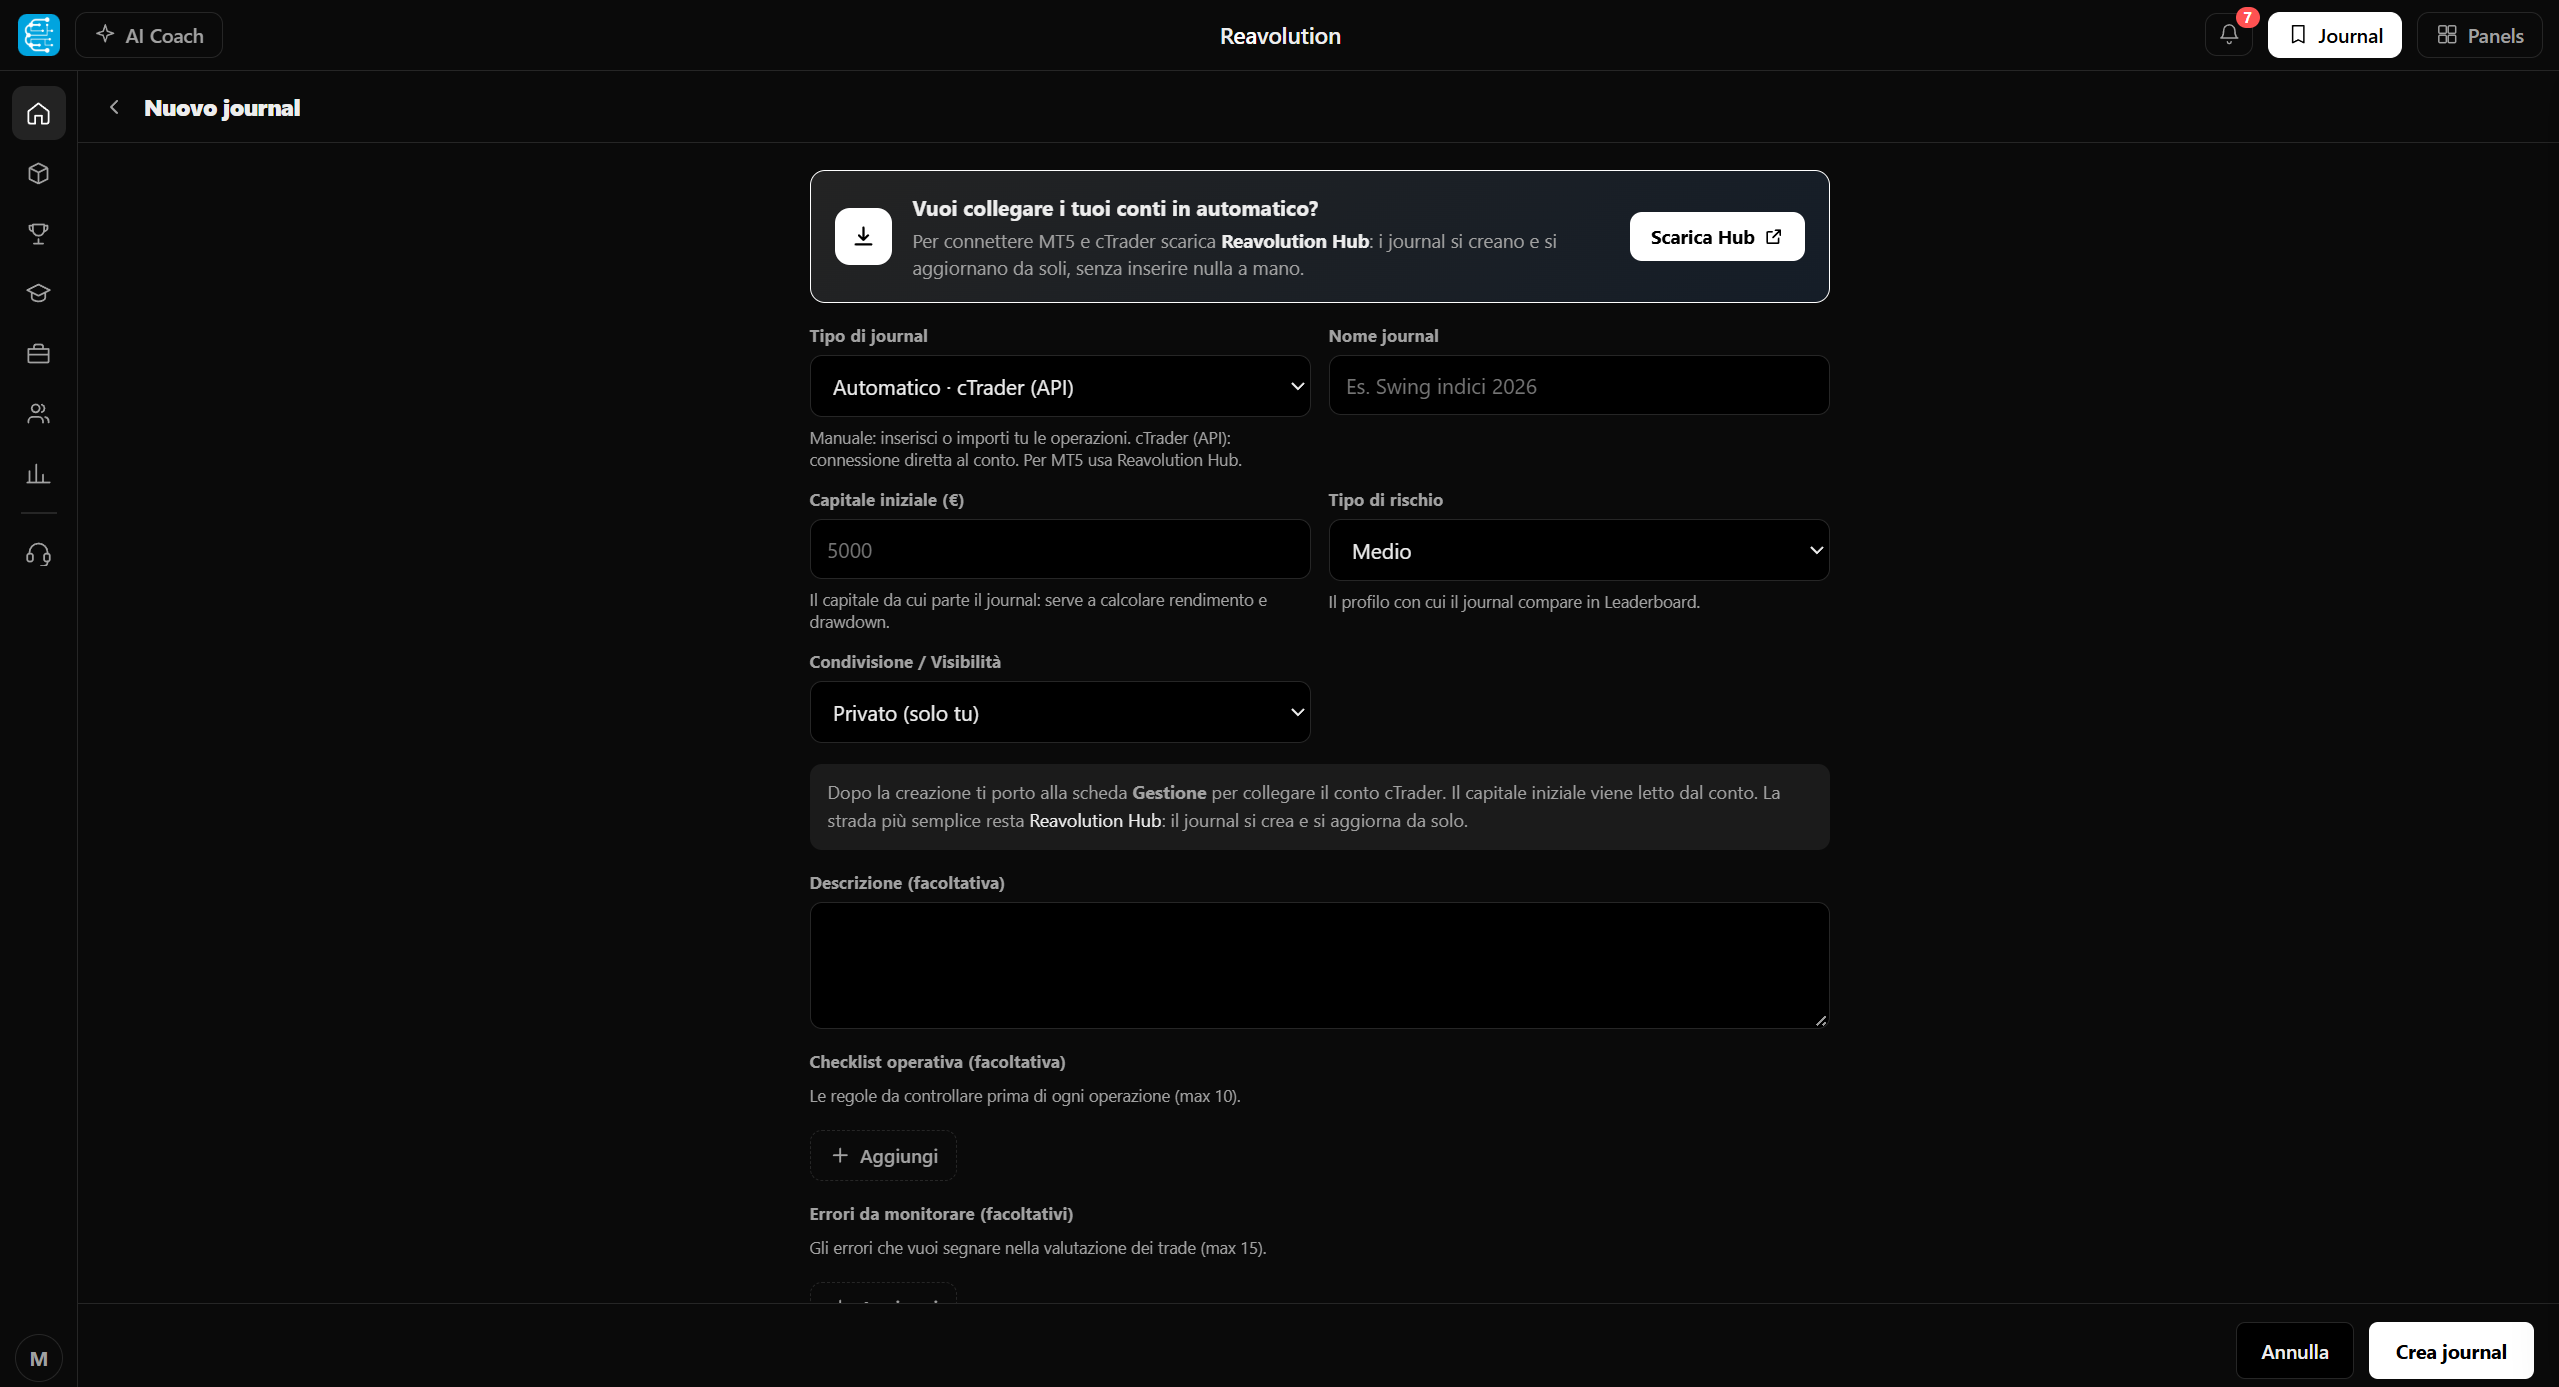
You can choose to make your journal public and compare yourself with other traders. Always optional, always under your control.
Share your real performance with the community.
Learn from other traders' strategies.
You can keep sensitive information private.
One subscription for the whole platform: tools, Vega AI and the Windows Hub. Pick the duration you prefer.
To get started, no commitment.
To evaluate the platform at your own pace.
The balance between flexibility and savings.
For those who take trading seriously.
I'm new to the field and I got to know this world much better thanks to them. The tools are truly remarkable and simple. Whenever I was in difficulty I always received great support. Congratulations, keep it up.
I found this site by chance while trying to understand what trading was, and here I found not only the information I was looking for but also tools that help me understand the market more easily.
I'm really satisfied. Despite my little experience, they patiently helped me get into this world. Highly recommended.
You download the Excel (.xlsx) file from MT5 or cTrader and drag it into the upload area. The Journal recognises the format and updates statistics and charts in seconds. Alternatively you can connect your account directly.
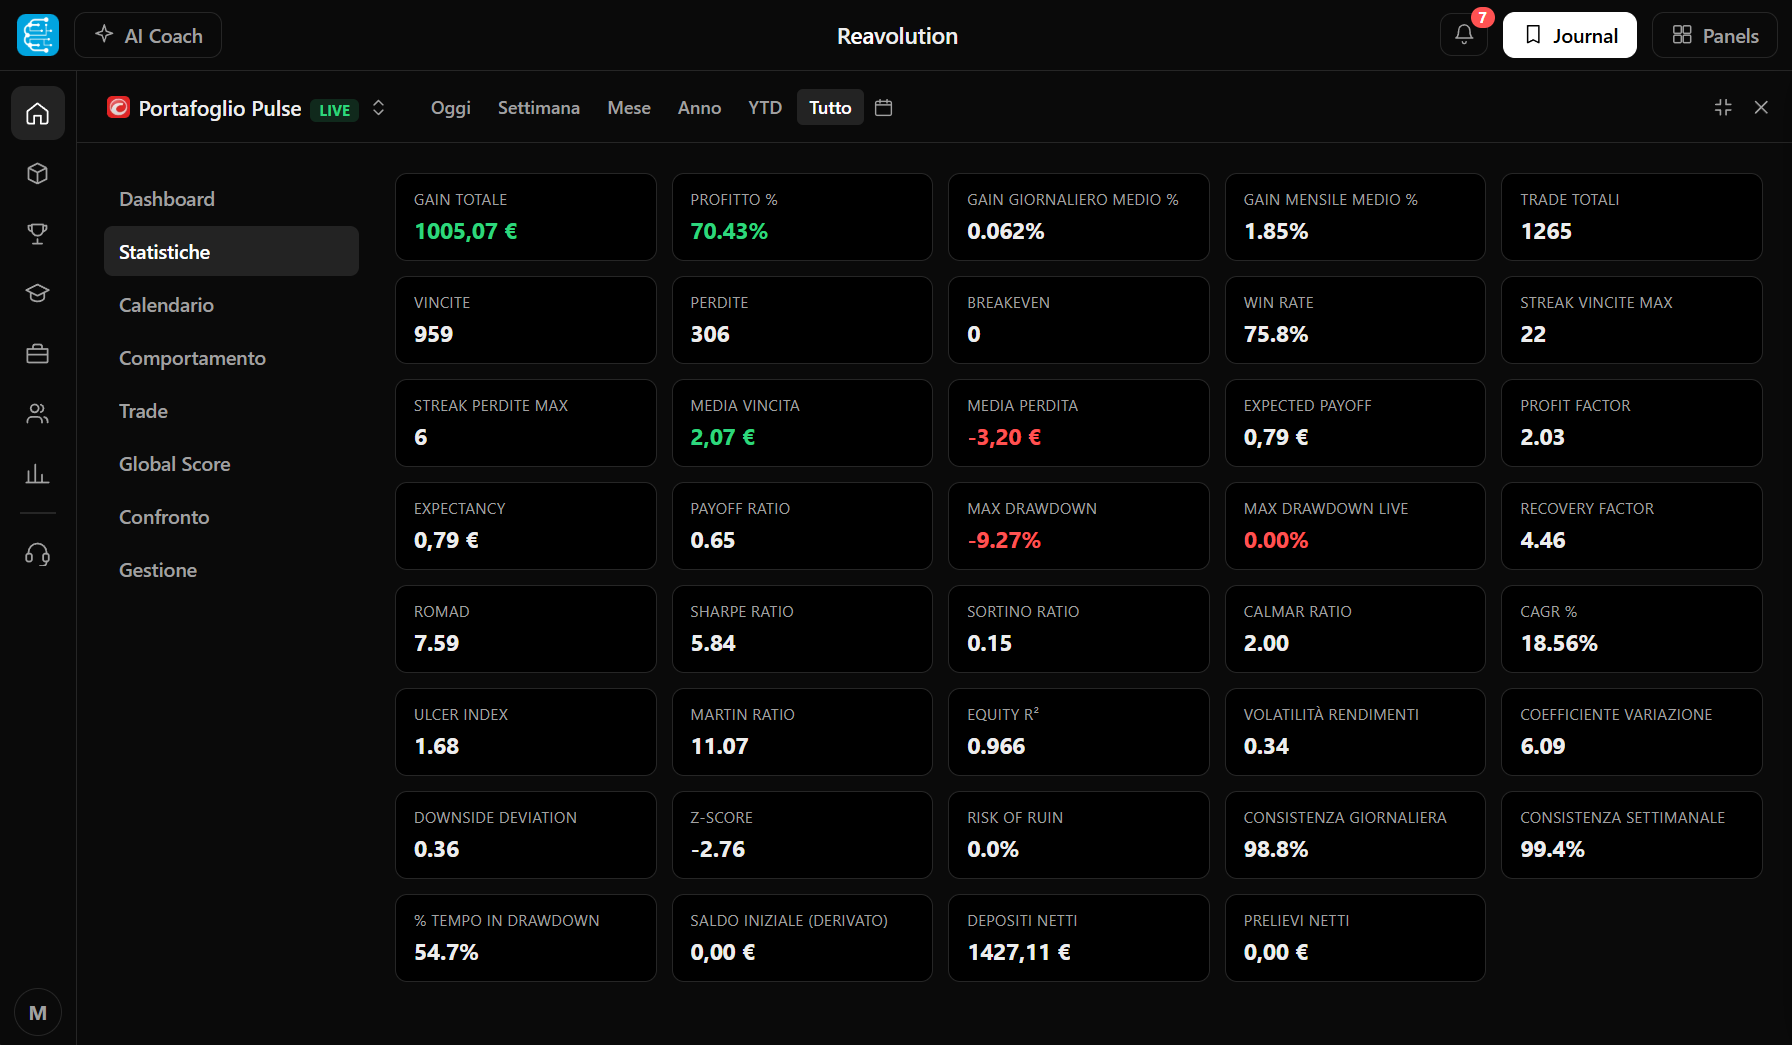
30+ metrics: win rate, profit factor, Sharpe ratio, maximum drawdown, average win/loss, analysis by asset, timeframe and strategy, plus the interactive equity curve and correlations between emotional state and performance.
For each trade you record your emotional state before, during and after the trade using preset scales. The Journal then analyses correlations with results to help you work on discipline.
Yes, it's optional: you can make it public and join the Leaderboard. You choose what to share and what to keep private.
Yes. For each trade you can add notes, chart screenshots, the strategy used and the reasons behind your choice, to review decisions objectively.
Yes, you can export your Journal data for external analysis.
Charts with your account's real prices and real orders, price alerts and tools in the layout.
DiscoverDirectional score on 41 symbols, updated in real time.
DiscoverCFTC institutional positioning, week by week.
DiscoverSystematic monthly rotation across US sectors.
DiscoverREA indicators and utilities right on your MT5 and cTrader charts.
DiscoverThe voice and chat assistant that drives the Hub and reads your data.
DiscoverNews from 100+ sources with impact analysis.
DiscoverMacro events, alerts and an AI read of the day.
DiscoverTest your strategies on historical markets, candle by candle or tick by tick.
DiscoverRisk calculators and the extra tools only in the Hub.
DiscoverStart tracking, analysing and improving your trading with professional tools.
Leave your details and one of our experts will contact you to find the best path for you.
We use your data to answer your request and, only if you gave consent, for promotional communications. Details in the Privacy Policy.