


Trading Journal
Dedicated to monitoring and analyzing your every trade, to help you constantly improve your strategies. Each entry includes crucial details such as date, invested capital, gains or losses, and personal notes, to give you a clear view of your progress. Use this journal to reflect on your decisions, learn from mistakes and celebrate successes. Happy trading!

All the features of the Trading Journal


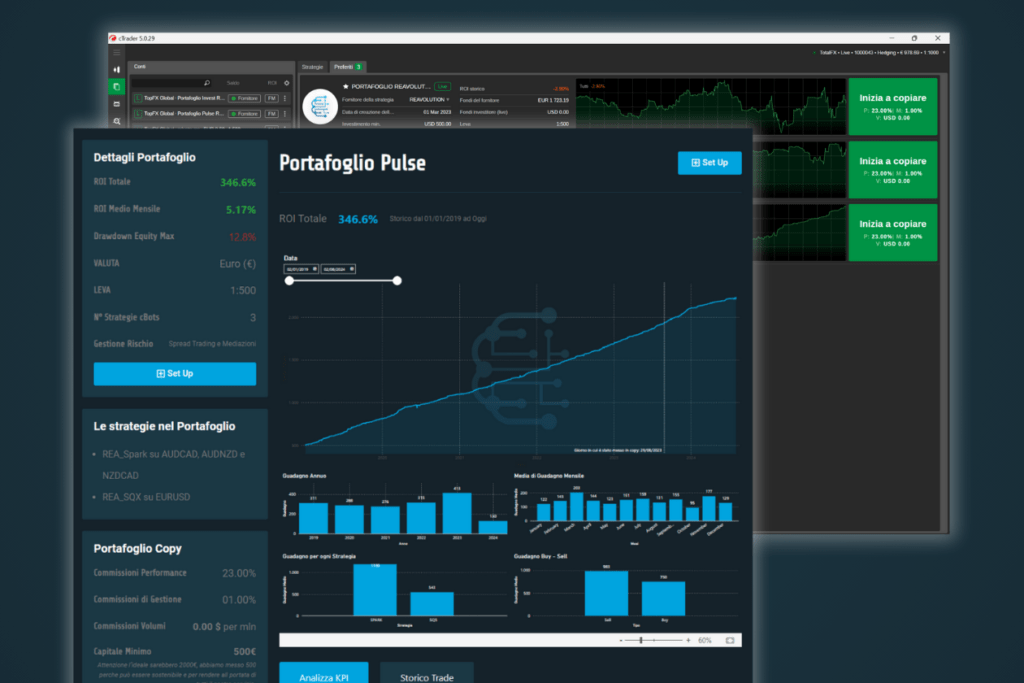
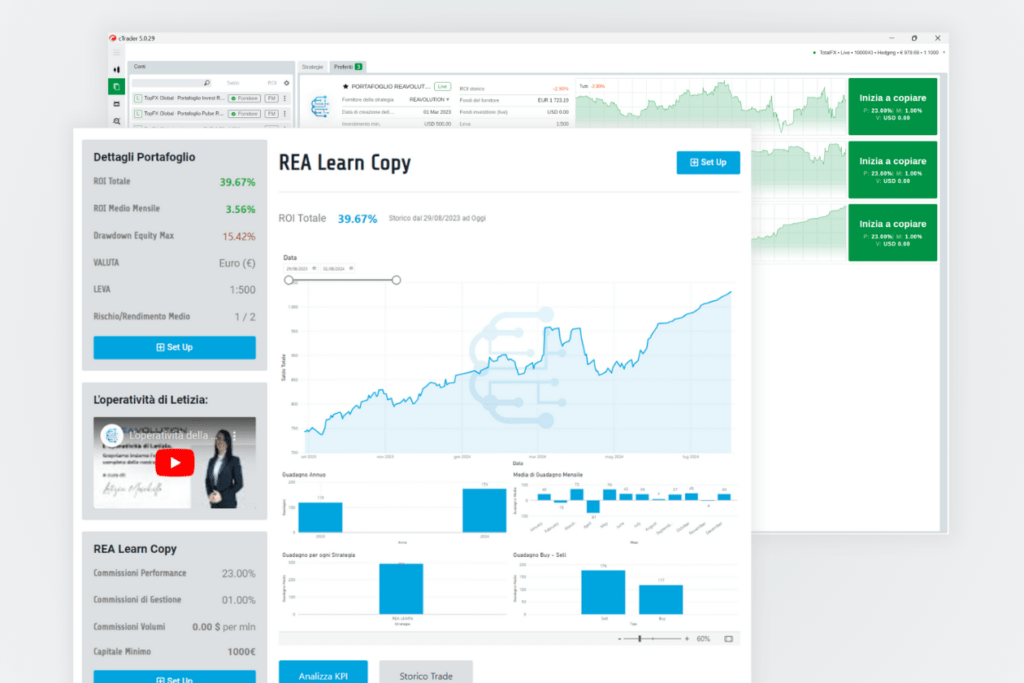
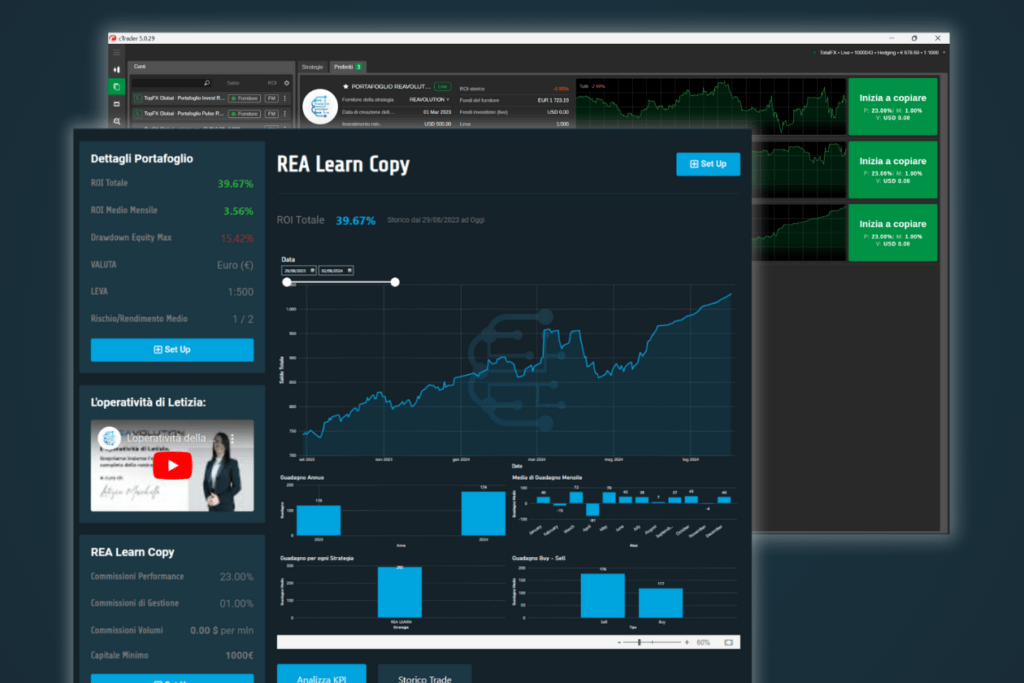
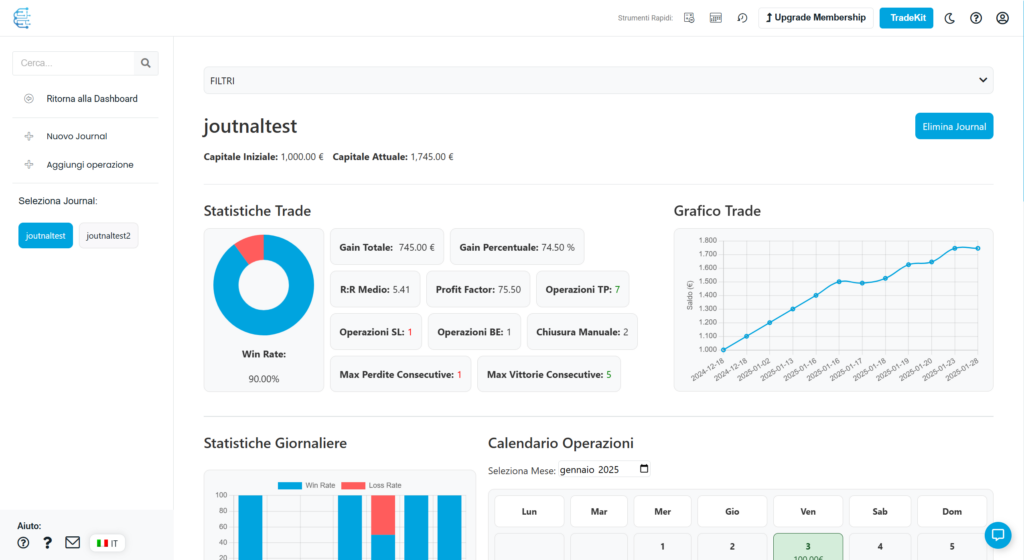
Statistics and Chart
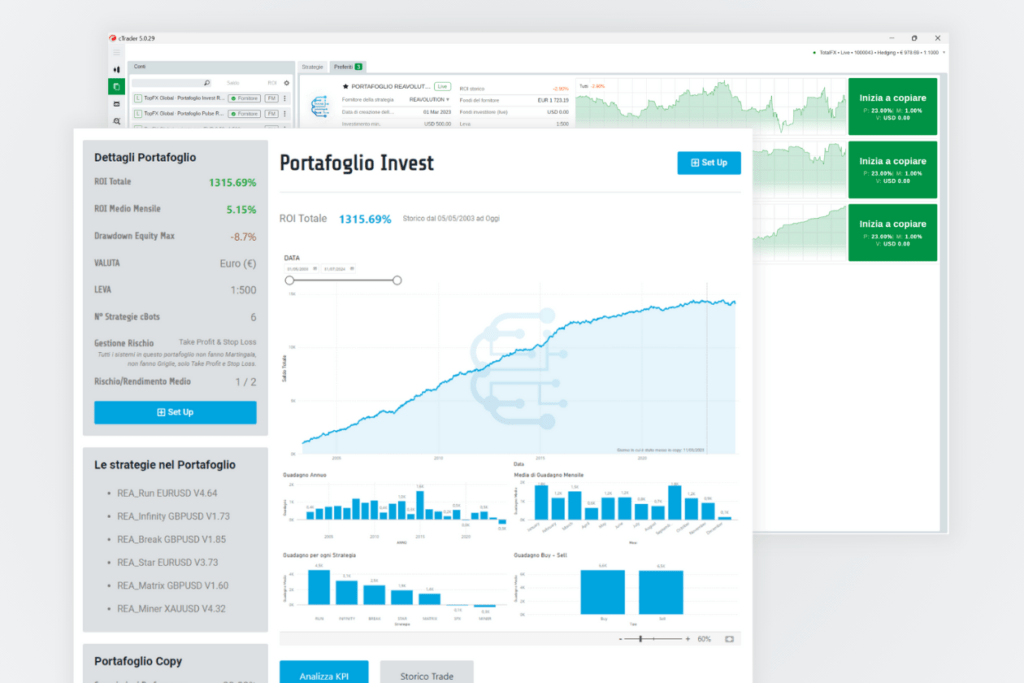
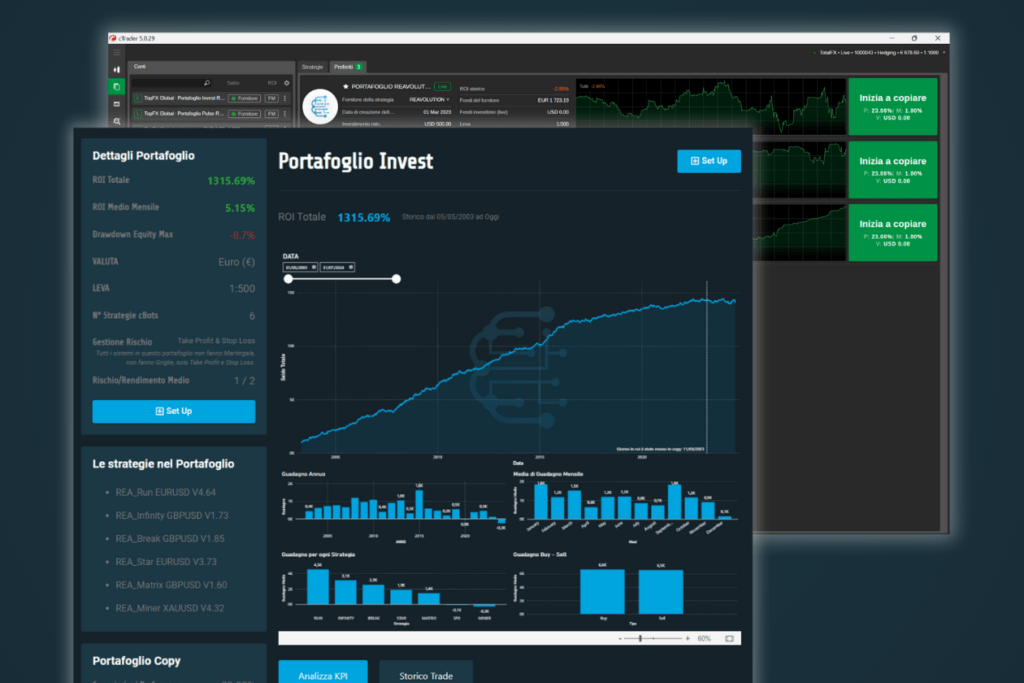
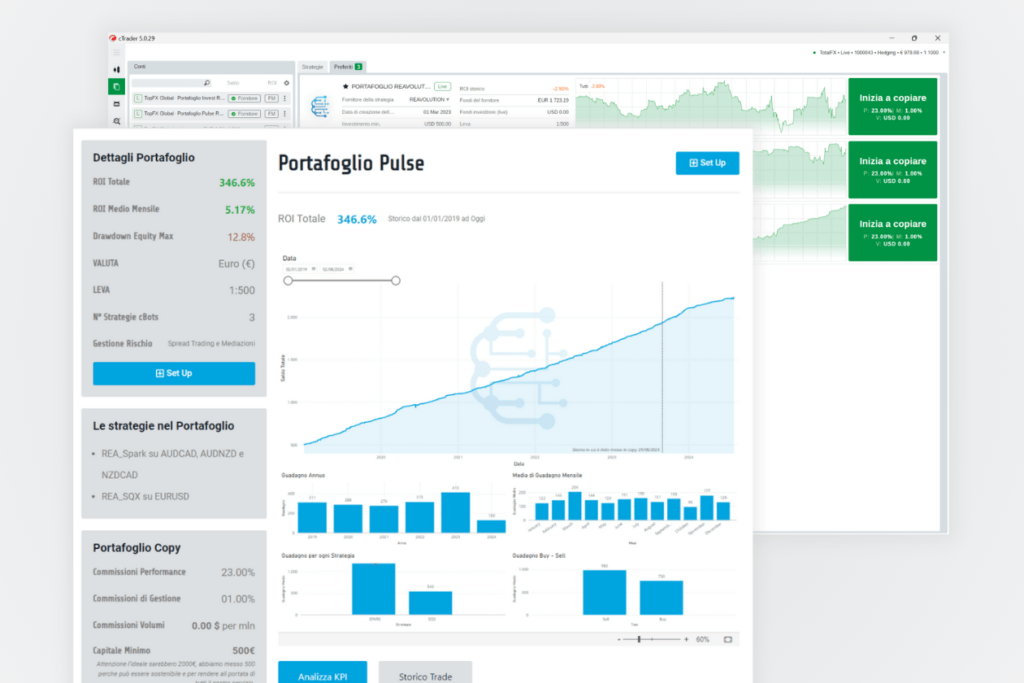
This section gives you a visual and numerical overview of your trading performance. The interactive graph shows the performance of your capital over time, allowing you to analyze the evolution of your investments. Statistics provide a detailed assessment of your gains, losses, success rates and other key indicators that will help you identify strengths and areas for improvement. Use this data to refine your strategies and make increasingly informed decisions.
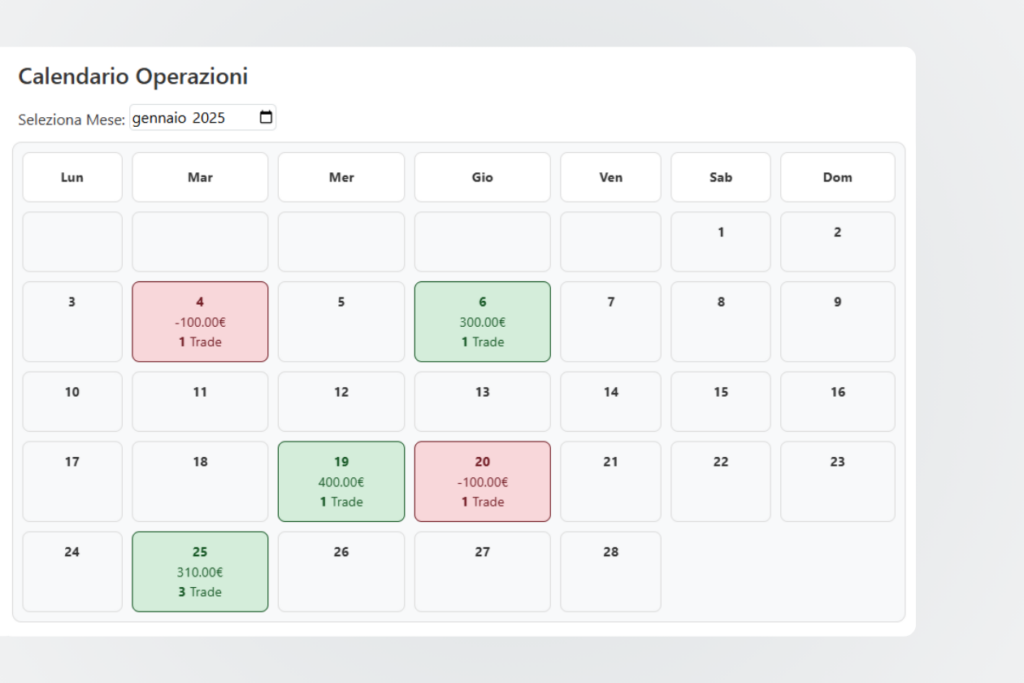
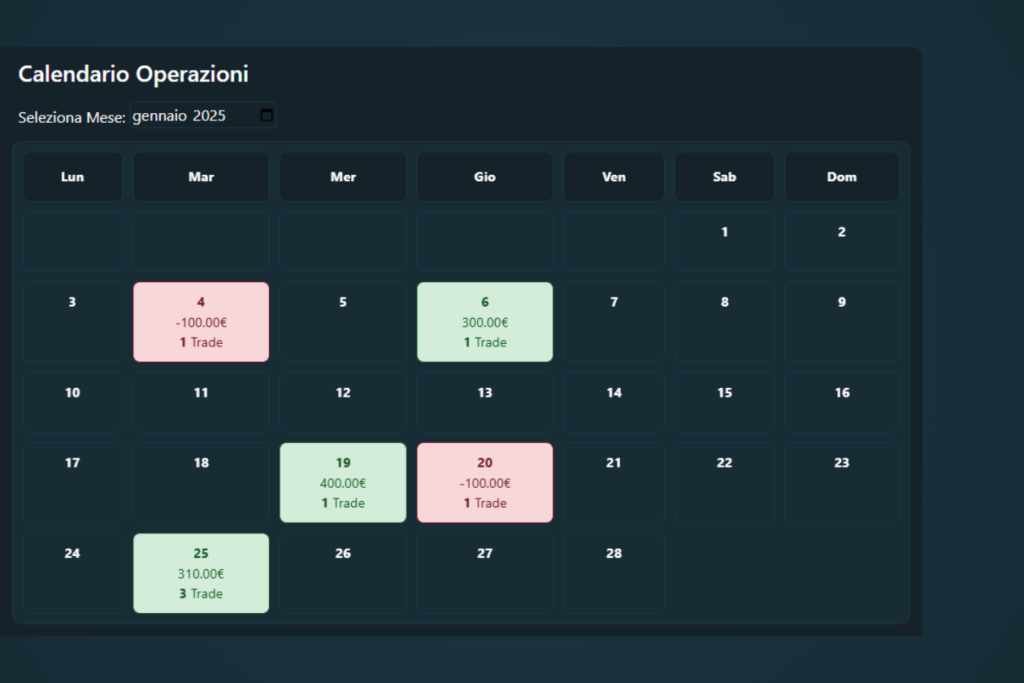
Schedule of Operations
The calendar gives you a detailed overview of your daily trades, with the total sum of your gains and losses for each day. Each date is accompanied by the total number of transactions made, allowing you to see at a glance how your capital has changed over time. This view helps you easily identify the most profitable days or those where you suffered losses, making it easier to analyze your trading habits and optimize your strategies.
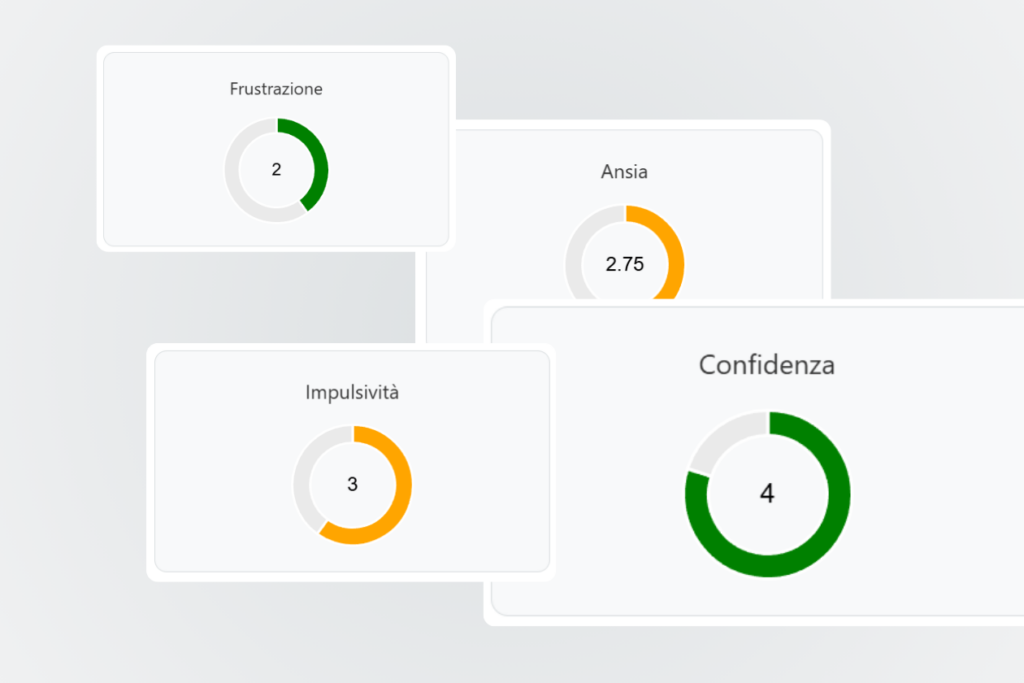
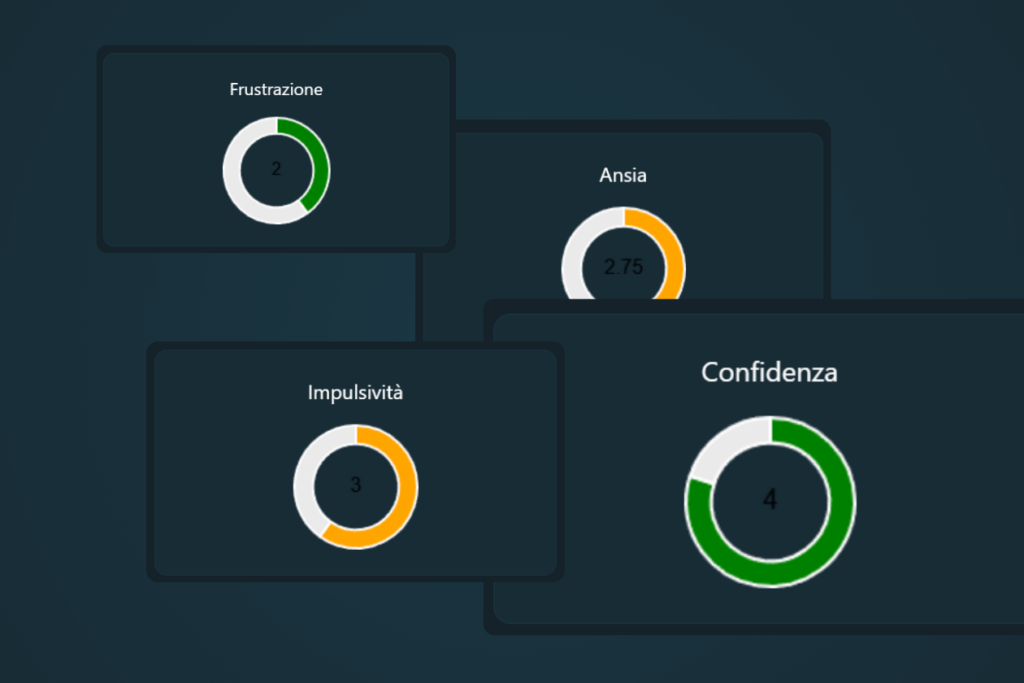
Monitora le tue emozioni
Nel trading, ogni decisione è influenzata non solo dai dati ma anche dalle emozioni. Riconoscere e gestire stati emotivi come impulsività, confidenza, ansia e frustrazione è essenziale per mantenere lucidità mentale, coerenza operativa e migliorare le performance nel tempo. Con il nostro Trading Journal puoi monitorare costantemente queste emozioni, analizzare come influenzano le tue operazioni e sviluppare maggiore consapevolezza emotiva. Questo approccio ti aiuta a prendere decisioni più razionali, ridurre gli errori dettati dalla reattività e costruire una strategia solida e sostenibile. Trasforma l’emotività in un punto di forza: con Reavolution hai il controllo totale anche sul tuo mindset.
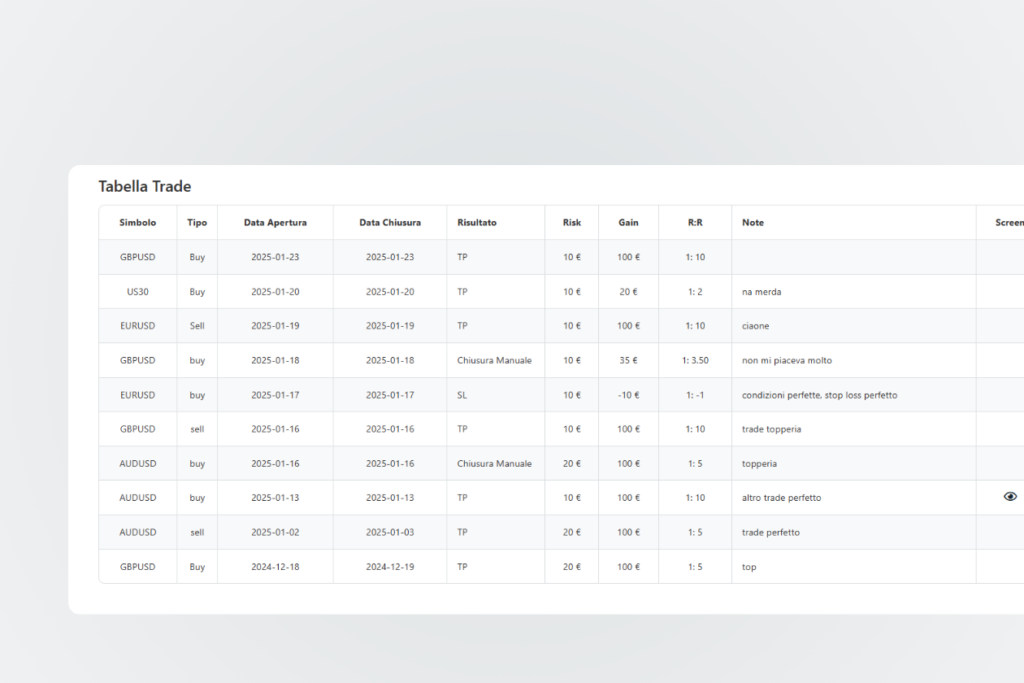
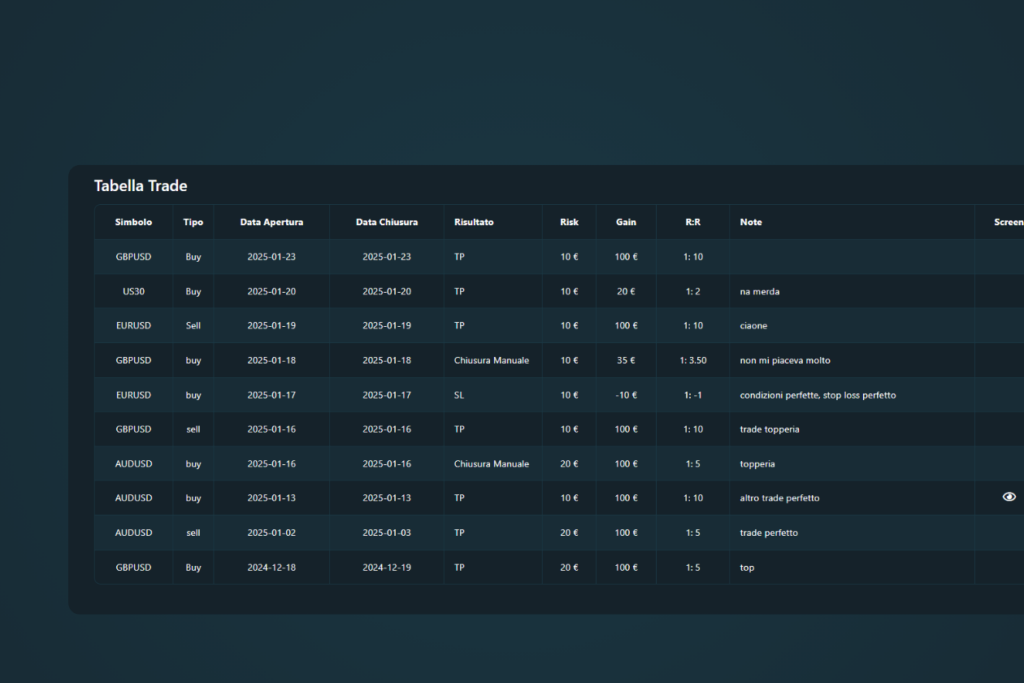
Operations Table
This table provides a complete and detailed view of each trade you make. Each row displays crucial information such as the symbol, the type of trade, the opening and closing dates, the final result, the risk and profit obtained, as well as the risk/reward ratio (R:R). In addition, you can add personal notes for each trade and view screenshots of the trades, providing a visual aid for reviewing the decisions you have made. Use this section to monitor your work, analyze your choices and constantly improve your performance.
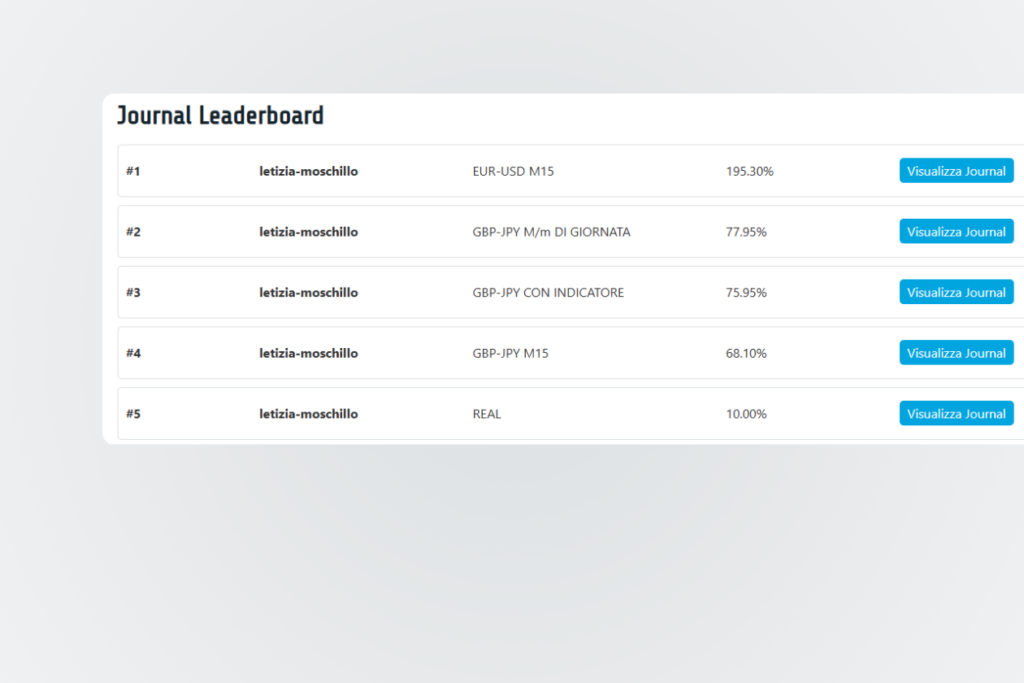
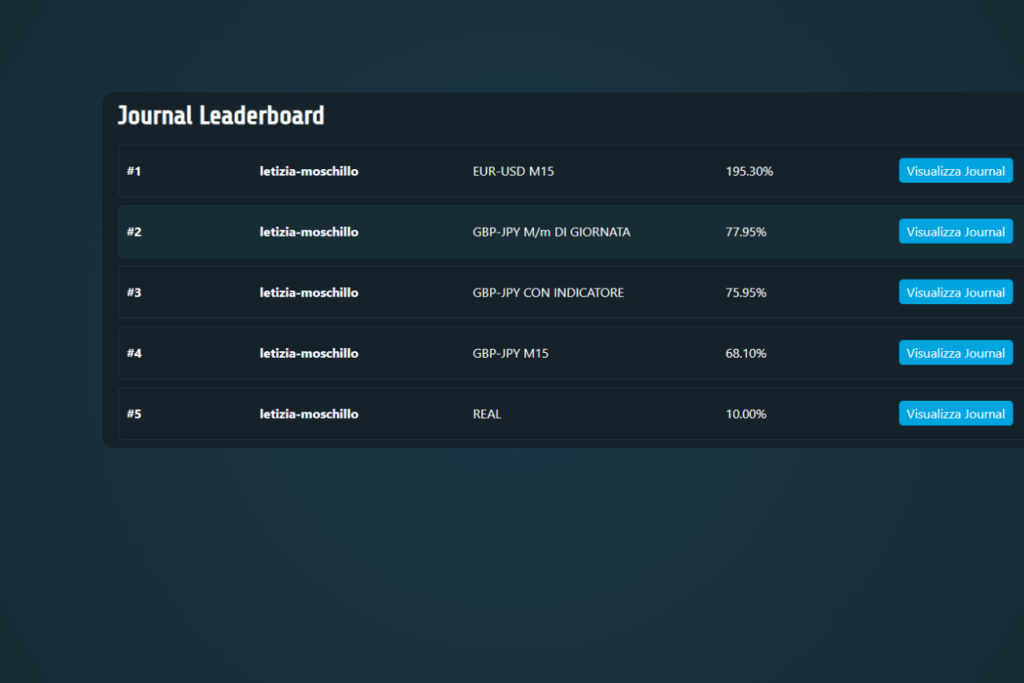
Journal Leaderboard
There Leaderboard dei Journal di Reavolution è una classifica dinamica che evidenzia i trader più attivi e trasparenti della nostra community. Condividendo i propri diari di trading in modalità pubblica, gli utenti possono confrontarsi, ispirarsi e apprendere dalle esperienze altrui. Questa classifica promuove l’apprendimento collaborativo e la crescita personale, offrendo a ciascun trader l’opportunità di migliorare attraverso l’analisi delle performance e delle strategie condivise. Unisciti alla nostra community e scopri come la trasparenza e il confronto possono elevare il tuo trading a nuovi livelli.
All Plans
Scegli il piano che preferisci o seelziona entrambi gli abbonamenti per ottenere uno sconto.
16% di sconto annuale. È come 60 giorni gratuiti 😍
Everything in the TradeKit plan plus:
- Trading Journal
- Journal Leaderboard
- Condivisione Trading Journal
Everything in the free plan plus:
- TradeKit Indicators
- TradeKit Utility
- cBot TradeKit
- Video explanation of each strategy
16% di sconto annuale. È come 60 giorni gratuiti 😍
Everything in the free plan plus:
- Trading Journal
- Journal Leaderboard
- Condivisione Trading Journal
Everything in the free plan plus:
- TradeKit Indicators
- TradeKit Utility
- cBot TradeKit
- Video explanation of each strategy
What our users say
Here you can find some reviews, Find all the reviews of our users on Trustpilot!

Frequently Asked Questions
To add a new trade, simply click on “Add Trade” and enter all the required details, such as the symbol, trade type, opening and closing date, result and other relevant information.
Yes, in the trade table you can upload a screenshot of your trade to have a visual aid to help you review your choices.
Yes, you can add notes, screenshots and other custom information for each trade, to have a complete record of all your choices and analyses.
Yes, you can modify any operation at any time by accessing the “Operations” section and clicking on the edit icon next to the desired operation.
Yes, you can filter your transactions using different criteria. You can choose the symbol, The type of operation (for example, Buy or Sell), the start date and the end date, and the result (TP, SL, BE and Manual Closing). This allows you to view only the operations that match the criteria you have selected, for a more targeted and detailed analysis.
You can view your overall performance in the graph and statistics, which will give you a visual and numerical analysis of your capital and performance over time.
Use personal notes to jot down your thoughts during each trade and analyze the losing days in the calendar. The statistics and graph will help you spot patterns in your mistakes.
The “Risk” column indicates how much of your capital is at risk in each trade, while “R:R” represents the ratio between risk and profit obtained, useful for evaluating the profitability of each trade.