


Description
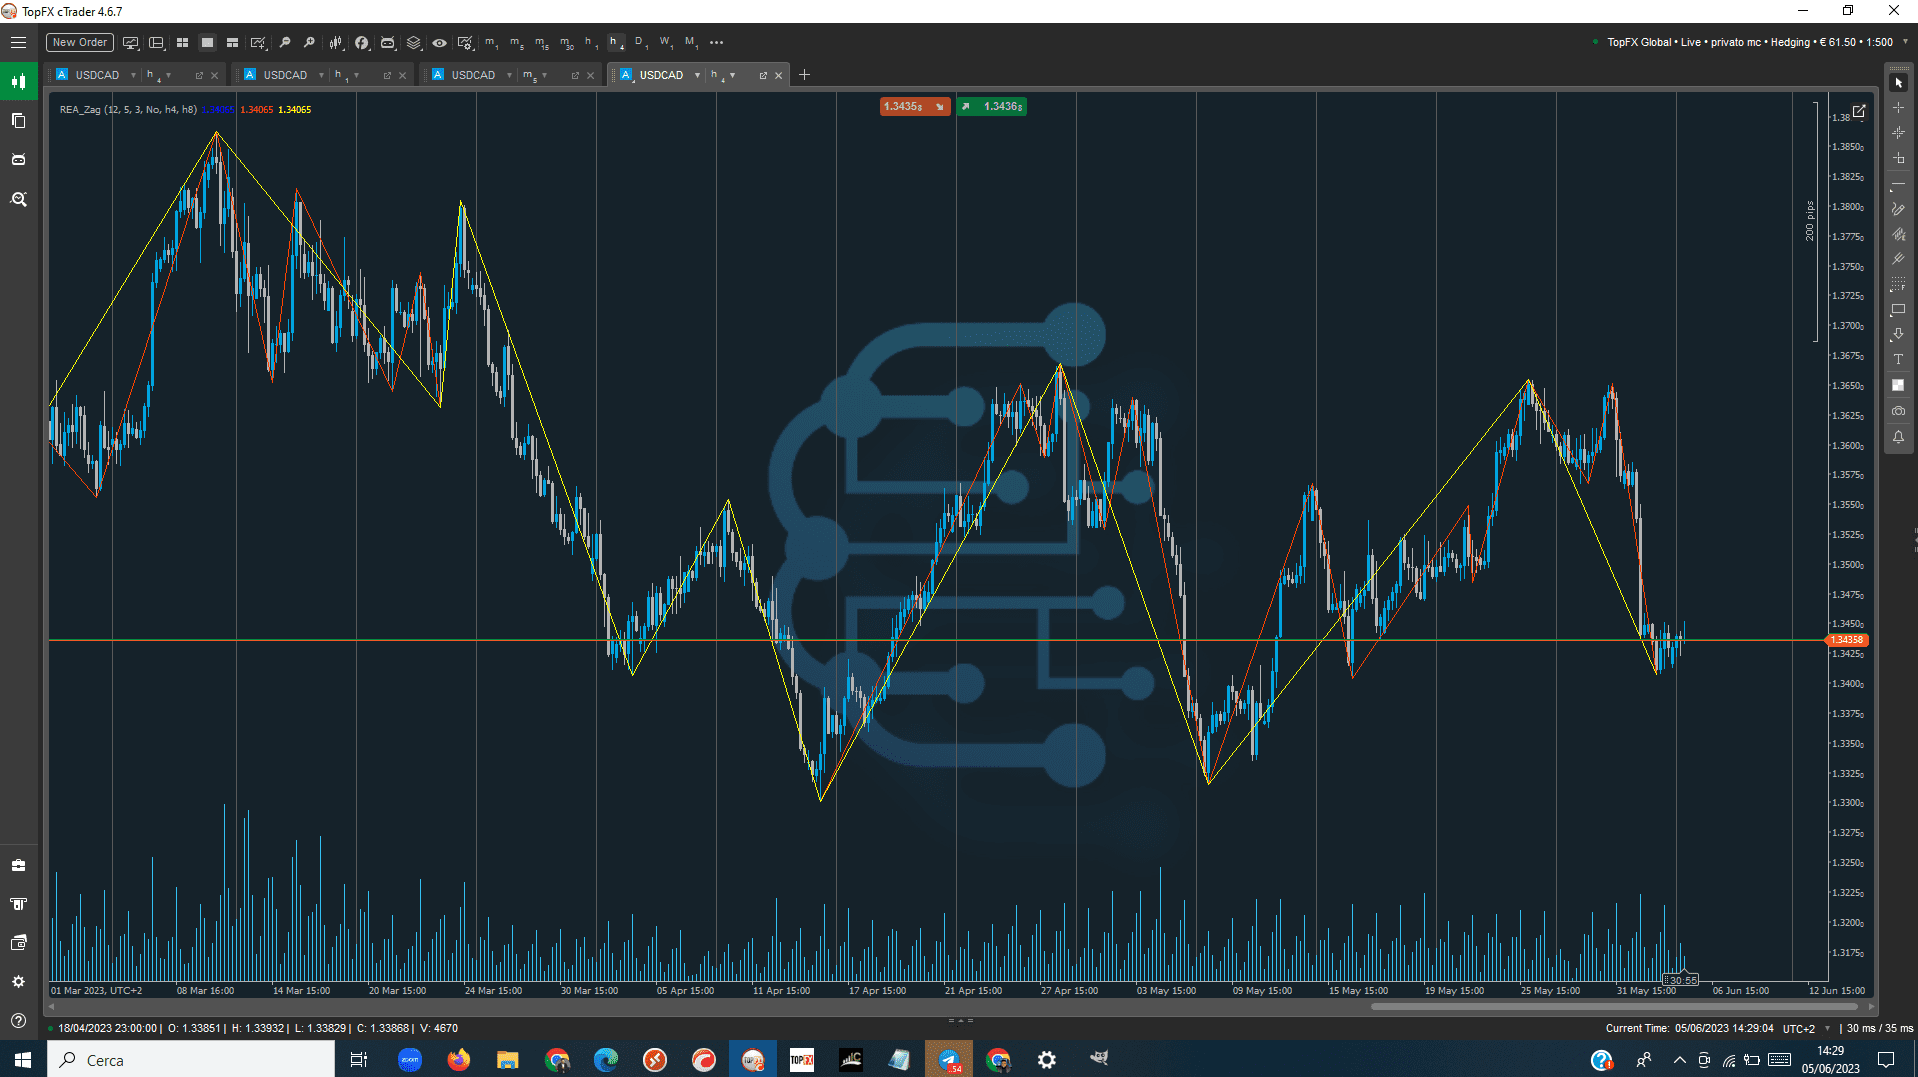
The Zig Zag indicator reduces the impact of random price fluctuations and is used to identify price trends and changes in price trends. It lowers noise levels, highlighting underlying trends further and further down, and works best in strongly trending markets.
The Zig Zag indicator plots points on a chart whenever prices reverse by a greater percentage than a chosen variable. Straight lines are then drawn, connecting these points. ZIG ZAG is used to help identify price trends. It eliminates random price fluctuations and attempts to show trend changes.
The so-called lines appear only when there is a price movement between a swing high and a swing low greater than a specified percentage, often 5%. By filtering out minor price movements, the indicator makes trends easier to spot across all time frames. While the Zig Zag indicator does not predict future trends, it helps identify potential support and resistance zones between plotted swing highs and swing lows.
The indicator can also reveal reversal patterns, i.e. double bottoms and head and shoulders tops. Traders can use popular technical indicators such as the Relative Strength Index (RSI) and Stochastic Oscillator to confirm whether a stock's price is overbought or oversold when the Zig Zag line changes direction.
Our indicator inserts up to 3 Zig Zags into the chart. one from the current TimeFrame of the Graph and the other two from the timeframes selectable in the parameters.
Parameters
- Deth: Select the Zig Zag Periods
- Deviation: Select the deviation in number of Candles
- BackStep: Fixed value at 3
- ShowHistory: Activate or deactivate with Yes or No the display of the past movements of each Zig Zag
- Timeframe 1: Select the first timeframe other than the one present in the graph.
- Timeframe 2: Select the second timeframe different from the one present in the graph.
Lines
- Select the color for each Line of the Zig Zag