


Description
REA_VolumeProfile for cTrader – Advanced Volume Analysis
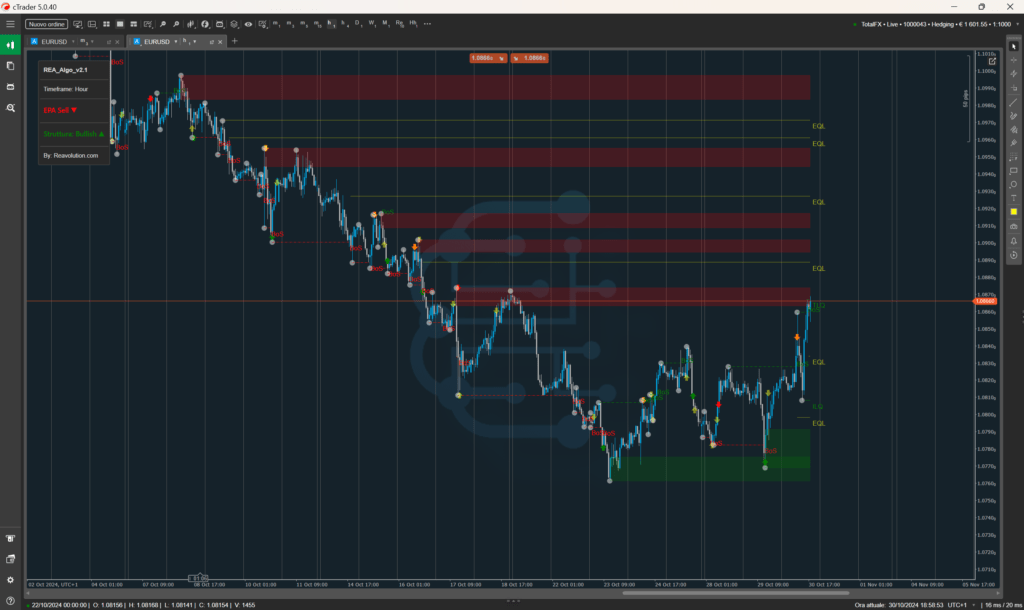
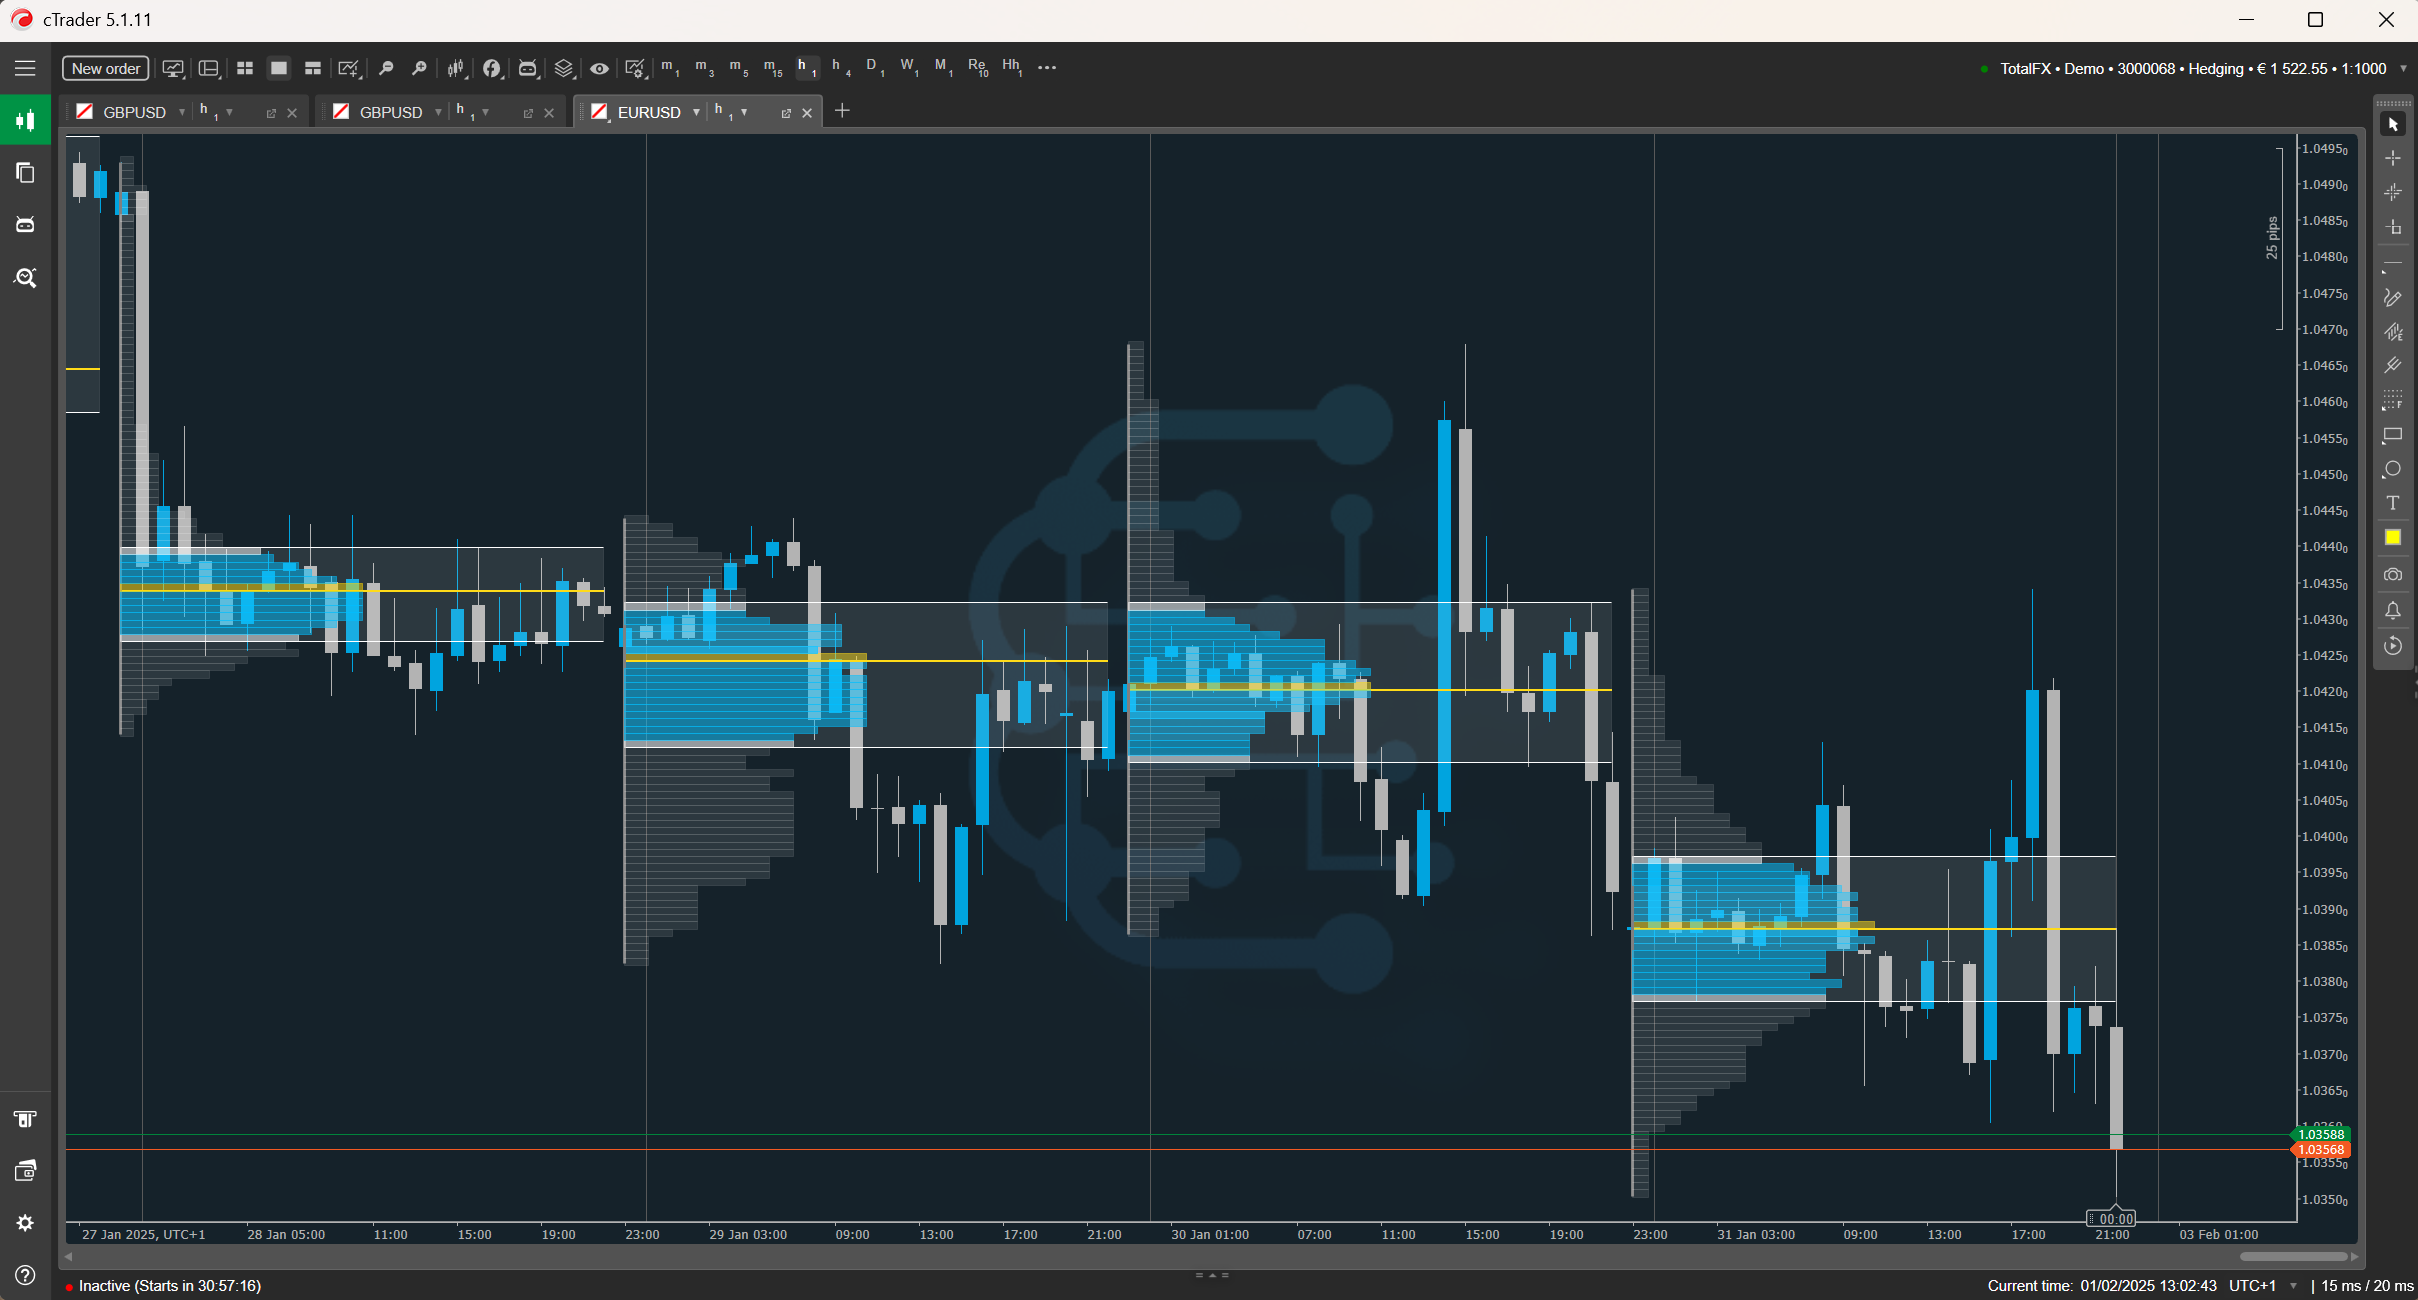
The indicator REA_VolumeProfile For cTrader is an advanced technical analysis tool that allows traders to visualize the distribution of trading volumes over specific price ranges. This indicator helps identify areas of greatest interest in the market, supporting more informed trading decisions.
Functionality
- Distribution of volumes – Shows the volume traded based on price levels, highlighting the areas of greatest activity;
- Point of Control (POC) – Identifies the price level with the highest volume, useful as a reference for supports and resistances;
- High & Low Value Area (VAH/VAL) – Highlights areas of accumulation and distribution, providing insight into future price movements.
- Advanced customization – Adjust the profile density and period via timeframe to suit your trading style.
- Extension of POC and VAH lines, VAL.
Parameters
Volume Profile
- No. of VPs back: Number of Volume Profiles to be drawn in the chart based on the period;
- Timeframe Calculation: Select the period for calculating the volume profile;
- Bar Color: Choose the color of the volume bars;
- Bar color inside VA: Choose the color of the volume bars inside the Value Area;
- Bar Opacity: choose the opacity of the bars from 0(not visible) to 100.
- Opacity bars inside VA: choose the opacity of the bars inside the Value Area from 0(not visible) to 100.
POC
- Extend POC line: Select yes if you want to view all POC lines up to the current day;
- POC Color: Choose the color of the POC line;
- POC Style: Choose the style of the POC line;
- POC Thickness: Choose the thickness of the POC lines;
Volume Area
- Extend VA lines: Choose Yes to extend the Value Area High and Volume Area Low lines.
- VA Lines Color: Choose the color of the Value Area lines;
- Opacity VA Lines: Choose the opacity of the Value Area lines;
- VA Line Style: Choose the style of the Value Area lines;
- VA Line Thickness: Choose the thickness of the Value Area lines;
- VAH line color: Choose the color of the Value Area High line;
- VAL line color: Choose the color of the Value Area Low line;