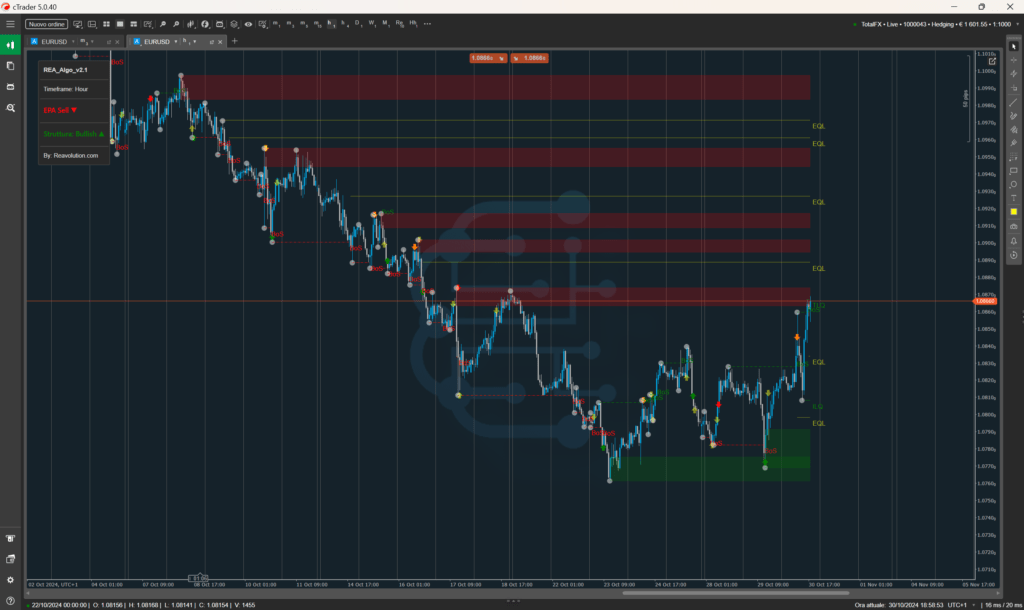
Description
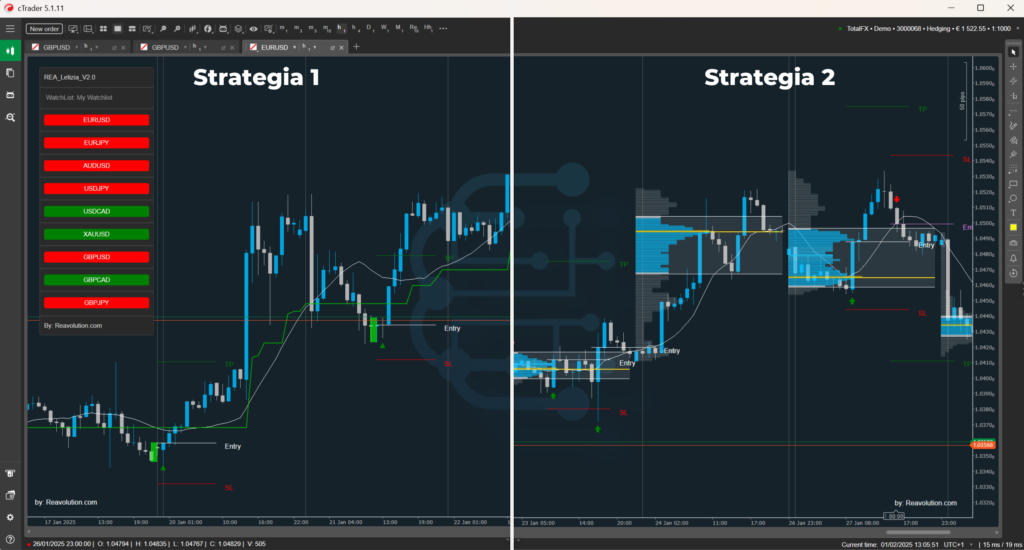
Rea_Letizia is an indicator for all types of intraday traders. Designed to perform best in small time frames (from M5 to H1) offering numerous entry opportunities over the weekly period.
Functionality
- 2 STRATEGIES WITHIN THE SAME INDICATOR
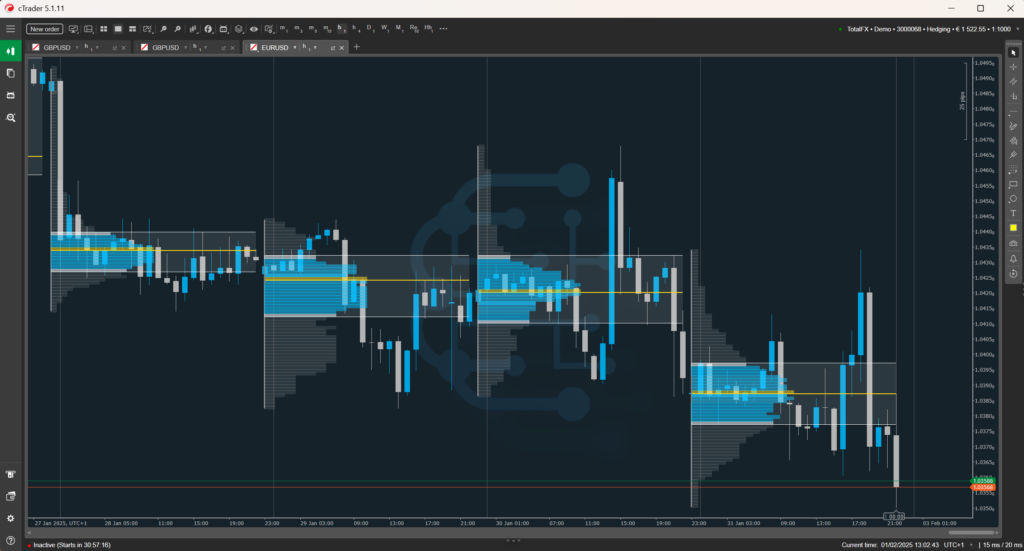
- VOLUME PROFILE
- Simple Moving Average
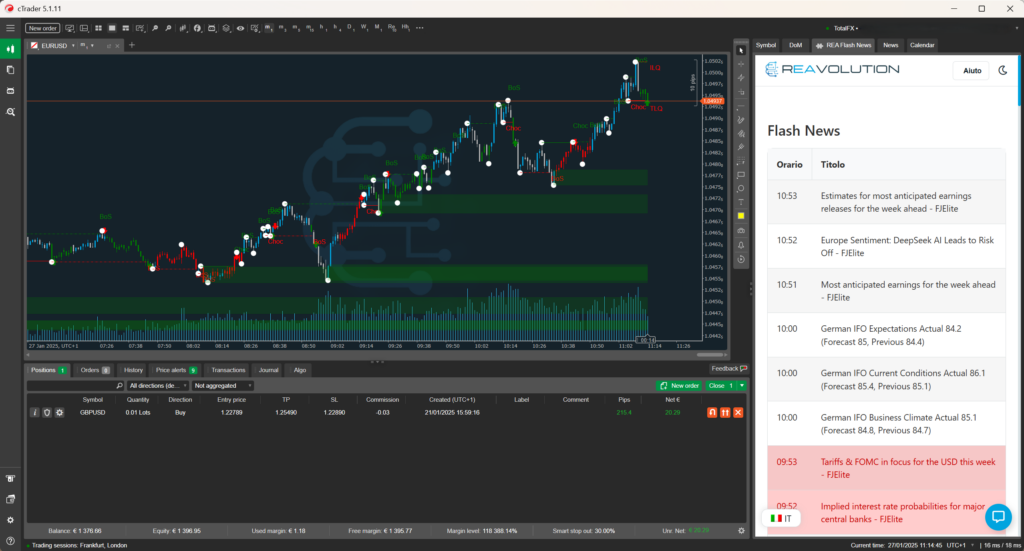
- Green or Red Trend Line
- Midline of the BBs
- Green or Red Arrow confirming entry of strategy 2
- Highlighting buy and sell project candles
- Buy or sell triangle confirming the entry of Strategy 1
- Potential trades with Entry line, Stop Loss (SL) line and Take Profit (TP) line for both strategy 1 and strategy 2
- Panel to quickly change pairs already knowing the direction of the trend
- Telegram signals with entry price, stop loss, take profit and the screenshot of the graph in question
Parameters
Strategy 1
- Strategy 1: Choose Yes to see Strategy 1 in the graph
- View Positions?: Set to Yes to view potential operations that can be performed with the indicator (Default: No)
- Operation length: Set a candle period which will be the length of the potential trade lines (Default: 10)
- Maximum Back: Set the number of back candles that the indicator must count to detect Highs or Lows to insert the stop loss (Default: 5)
- Add SL: Set the number of Pips you want to add from the minimum or maximum to the stop loss (Default: 10)
- TP Rewards: Set the Reward value to calculate the Take Profit, if you enter 2 your take profit will be 2 times your stop loss, for example: if the stop loss is 13 pips the tp will be entered at 26 (Default: 2)
Strategy 2
- Strategy 2: Choose Yes to see Strategy 2 in the graph
- View Positions?: Set to Yes to view potential operations that can be performed with the indicator (Default: No)
- Operation length: Set a candle period which will be the length of the potential trade lines (Default: 10)
- Maximum Back: Set the number of back candles that the indicator must count to detect Highs or Lows to insert the stop loss (Default: 5)
- Add SL: Set the number of Pips you want to add from the minimum or maximum to the stop loss (Default: 10)
- TP Rewards: Set the Reward value to calculate the Take Profit, if you enter 2 your take profit will be 2 times your stop loss, for example: if the stop loss is 13 pips the tp will be entered at 26 (Default: 2)
Bollinger Bands
- Bollinger Bands Deviations: Sets the deviation of the Bollinger bands (Default: 1.5)
- Bollinger Bands Periods: Sets the Bollinger Band periods (Default: 20)
- Bollinger Bands MA Type: Sets the type of Moving Average for the Bollinger Bands calculation (Default: Simple)
- Source: (Default: Close)
- Break Info: Set to Yes if you want to display the upper or lower Bollinger band breaking text (Default: No)
Stochastic Oscillator
- Kslowing: Set K slowing (Default: 6)
- %D Period: Set the period to calculate percentage D (Default: 3)
- %K Period: Set the period to calculate percentage K (Default: 10)
- MA Type: Set the type of Moving Average for Stochastic oscillator calculation (Default: Simple)
- UP Limit: Sets the level at which the oscillator will be overbought (Default: 50)
- Down Limit: Sets the level at which the oscillator will be oversold (Default: 50)
TrendLine
- Periods: Set the periods for calculating the Trend Line (Default: 12)
- Multiplier: Set the multiplier for the Trend Line calculation (Default: 2)
- ATR Smooth Type: Set the type of Moving Average for smoothing in the Trend Line calculation (Default. Exponential)
- Volume Date: Set to Yes if you want to include Tick Volumes for Trend Line calculation (Default: Yes)
SMA
- Periods (9): Select SMA periods (Default: 9)
Volume Profile
- No. of VPs back: Number of Volume Profiles to be drawn in the chart based on the period;
- Timeframe Calculation: Select the period for calculating the volume profile;
- Bar Color: Choose the color of the volume bars;
- Bar color inside VA: Choose the color of the volume bars inside the Value Area;
- Bar Opacity: choose the opacity of the bars from 0(not visible) to 100.
- Opacity bars inside VA: choose the opacity of the bars inside the Value Area from 0(not visible) to 100.
POC
- Extend POC line: Select yes if you want to view all POC lines up to the current day;
- POC Color: Choose the color of the POC line;
- POC Style: Choose the style of the POC line;
- POC Thickness: Choose the thickness of the POC lines;
Value Area
- Extend VA lines: Choose Yes to extend the Value Area High and Value Area Low lines.
- VA Lines Color: Choose the color of the Value Area lines;
- Opacity VA Lines: Choose the opacity of the Value Area lines;
- VA Line Style: Choose the style of the Value Area lines;
- VA Line Thickness: Choose the thickness of the Value Area lines;
- VAH line color: Choose the color of the Value Area High line;
- VAL line color: Choose the color of the Value Area Low line;
Panel
- Watchlist: Enter the name of the watchlist you want to observe, leave unchanged or blank if you don't want the panel
- N Pair: Enter the number of pairs you want to display in your panel (Default: 5)
- Vertical Position: Set the vertical position of the panel (Default: Top)
- Horizontal Position: Set the horizontal position of the panel (Defaul: Left)
Permission
- Username: Enter your site username, making sure to capitalize correctly
- User Email: Enter the email with which you registered on the site
Telegram
- Telegram: Active with Yes or Inactive with No
- Tokens: Enter the Token (string of numbers and letters) of your Telegram Bot that will send the Signals
- chatID: Enter the ID of the Telegram chat where you want the messages to arrive
Lines
- MainBB: Choose the color of the midline of the Bollinger bands
- SMA: Choose the color of the Simple Moving Average
- Trends: Choose the color of the Neutral Line of the Trend Line
- Signal: Choose the color of the Trend Line signals
- Bullish: Choose the color of the Trend Line when the trend is bullish
- Bearish: Choose the color of the Trend Line when the trend is bearish


