Description
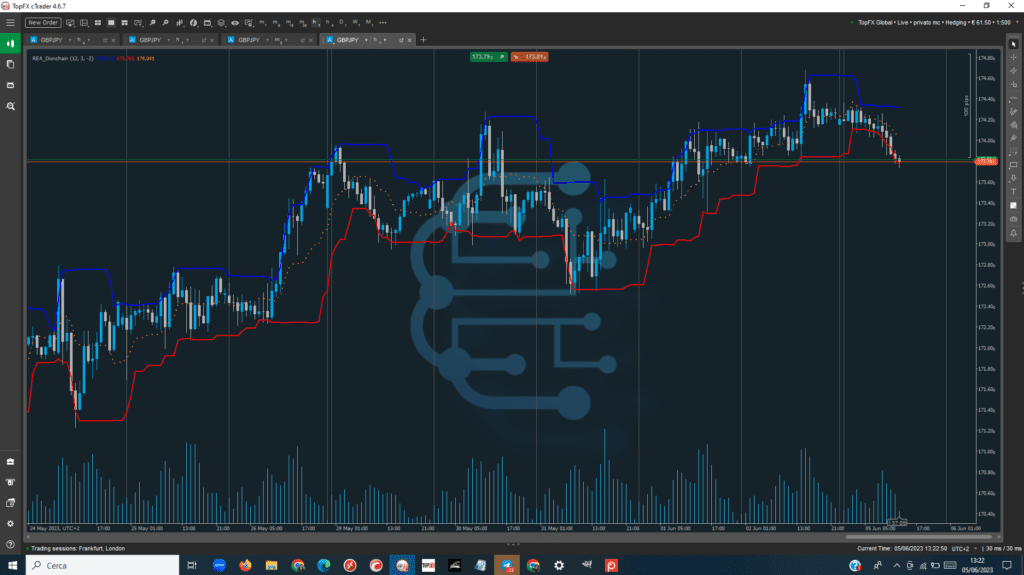
The Donchain Channel is an indicator that is used by traders to always have a reference of the maximum and minimum levels reached by the price in the most recent periods. This is an indicator based on three lines that always remain in the same order.
The highest indicates the maximum price reached by an asset in the last n periods, where n is an arbitrary number chosen by the trader based on his strategy. The lowest line indicates the minimum reached by the price in the same period, while the intermediate one is simply the arithmetic mean between the other two.
The first thing a trader must do to use the Donchain channel is to select a reference period. It is normally chosen in accordance with the trend being studied: for a long trend a higher number of periods is used and vice versa. This decision is already very important, because it clearly influences the position of the three lines on the graph.
Once the reference period has been selected, the platform processes the calculations to draw the three lines.
The ideal is that the calculation takes place on the highs and lows of the individual candles, not on their opening and closing prices; today some platforms also allow you to manually select this setting. If it is also possible to use the data of the current candlestick, it is better not to do so in order to remain closer to the traditional version of the instrument.
At this point we study the position of the three lines giving a first interpretation to the current situation:
· If the three lines are very close to each other, it means that the market volatility in the selected period was low;
· If on the contrary there is a significant gap between the three lines, it means that volatility is high or increasing. This is also one of the signals of the possible formation of a trend;
With the necessary exceptions, in the Donchain strategy it is considered that when volatility is low it is not the most appropriate time to enter the market.


