Description
Rea_Algo is an indicator for all types of intraday but also multiday traders.
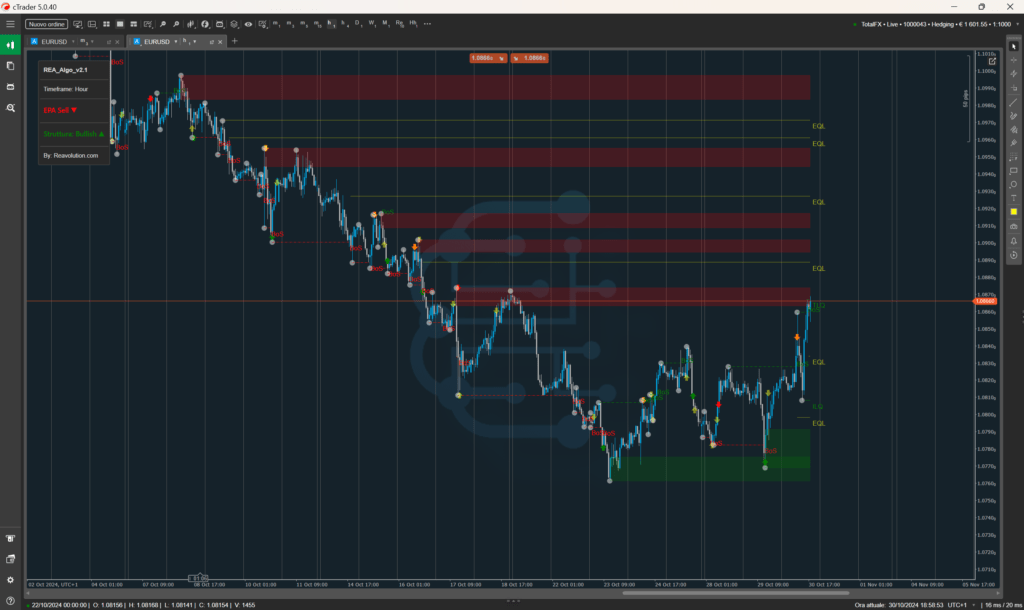
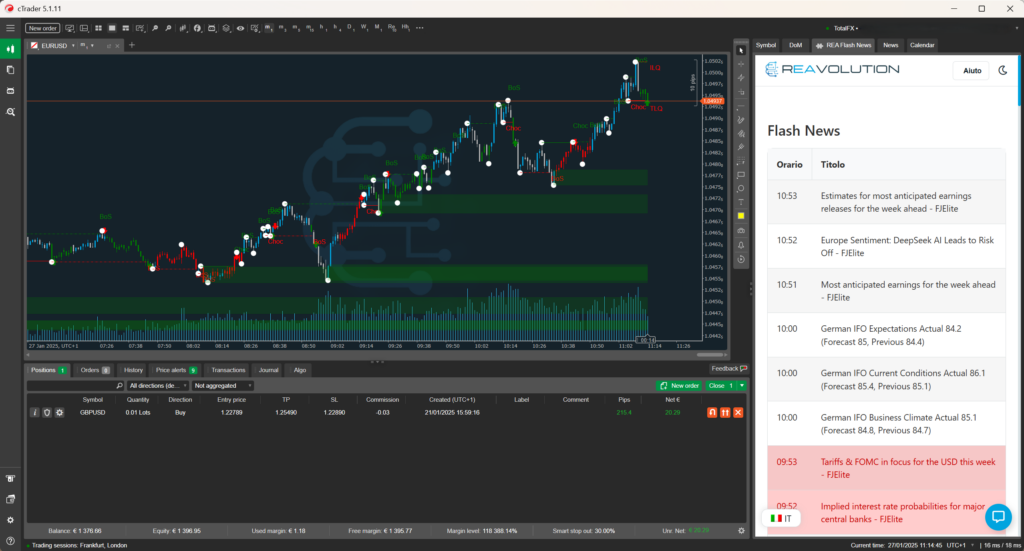
It is an indicator that uses different concepts of market liquidity to draw the various conditions on the chart and to help us identify possible market movements. This new version REA_Algo_V2.1 allows us to display the main liquidities, the equilibrium/money transfer zones, Protected Maximums and Minimums, IPA and EPA Zones within the Panel.
We have rebuilt the indicator from the ground up to make it as accurate as possible. The indicator now reads purely the price action to draw the structure without using candle counts, i.e. without using periods.
Functionality:
- Market structure HH, LL, HL, LH, or draw icons;
- Bos (Structural Breakdowns);
- ChoCh (Character Change);
- ILQ (Inducement Liquidity);
- TLQ (Transactional Liquidity);
- EQL (Equilibrium Zone/Money Transfer);
- Protected Maximums and Minimums;
- Arrow to take hold of Inducement Liquidity;
- Arrow to the grip of Equilibrium;
- Panel with information on the current Bearish or Bullish structure;
- Always inside the panel: IPA or EPA;
- Notifications in the cTrader platform;
- Signals on telegram with screenshots of the graph.
Parameters:
Notification
- Notification: Yes to enable notifications for each MSU and Equilibrium;
Structure
- Use close price: Yes to use the closing price of candles to calculate structure breakouts, No to calculate structures with highs and lows of candles to calculate structure;
- Show High-Low: Yes if you want to display labels on the highs and lows, otherwise leave it at no;
- Draw: Yes to draw icons to identify highs and lows, leave it at no to display labels or leave blank;
- Icon: Select the type of icon to identify the structure's highs and lows (Default: Circle);
- Color: Choose the color of the icon.
BoS
- Draw: Yes to draw the Bos, leave no if you don't want to draw them;
- Line Style: Decide the line style to identify the structure break line;
- UP – Color: Choose the color of the bullish breakout line;
- DOWN – Color: Choose the color of the downside breakout line.
ChoCh
- Draw: Yes to draw the Bos, leave no if you don't want to draw them;
- Line Style: Decide the line style to identify the character change line;
- UP – Color: Choose the color of the up line;
- DOWN – Color: Choose the color of the down changes.
IPA/EPA
- View IPA/EPA in the graph: Yes if you want to see the efficiency or inefficiency in the chart, by coloring the efficient candles.
- Color EPA Buy: Choose the color of the efficiency boost;
- Color EPA Sell: Choose the color of the efficiency down.
Equilibrium
- Draw: Yes to draw the Equilibrium lines and arrows, leave no if you don't want to draw them;
- Line Style: Choose the line style to identify equilibrium levels;
- UP – Color: Choose the color of the rising equilibrium;
- DOWN – Color: Choose the color of the downward equilibrium.
- Remove Taken: Yes to remove the levels, i.e. the equilibrium lines and labels, leave no to leave them drawn (they stop when the price reaches the line);
- Sound Notification: Choose the notification sound when the price reaches equilibrium.
MSU
- Draw MSU: Yes to draw MSU arrows, leave no if you don't want to draw them;
- Icon Buy: Select the MSU Buy icon;
- Color Buy: Choose the color of the MSU Buy icons;
- Icon Sell: Select the MSU Sell icon;
- Color Sell: Choose the color of the MSU Sell icons.
- Sound Notification: Choose the notification sound when an MSU occurs.
Protected
- Draw Protected: Yes to draw protected highs or lows, leave no if you don't want to draw them;
- High – Color: Choose the color of the Maximum Protections;
- Low – Color: Choose the color of the Protected Minimums;
- Opacity: 0 to 100, sets the opacity of the zones;
- Remove Taken: Yes to remove the violated zones, leave no if you want to leave them drawn (they stop when the price crosses the zone).
Panel
- Draw Protected: Yes to draw protected highs or lows, leave no if you don't want to draw them;
- High – Color: Choose the color of the Maximum Protections;
- Low – Color: Choose the color of the Protected Minimums;
- Opacity: 0 to 100, sets the opacity of the zones;
- Remove Taken: Yes to remove the violated zones, leave no if you want to leave them drawn (they stop when the price crosses the zone).


