Description
The ADX, acronym for the English term “Average Directional Index” is a trend indicator that measures the strength and intensity of a price movement in stock markets. The ADX was developed as an indicator of the strength of the trend of raw materials or commodities. The setting can be placed between 7 and 30. Settings with fewer periods will cause the average directional index to respond more quickly to price movement but these they tend to generate false signals and therefore make chart reading counterproductive. Higher period settings minimize false signals but make the ADX a severely lagging indicator in generating entry points. The ADX is a combination of different indicators: the Plus Directional Index (+DI) and the Minus Directional Index (-DI) and finally the ATR.
Graphically it is made up of three lines:
· ADX a line that indicates the strength of the trend without specifying the direction.
· +DI line derived from the measurement of bullish momentum.
· -DI line derived from the downward pressure indicator present in the market.
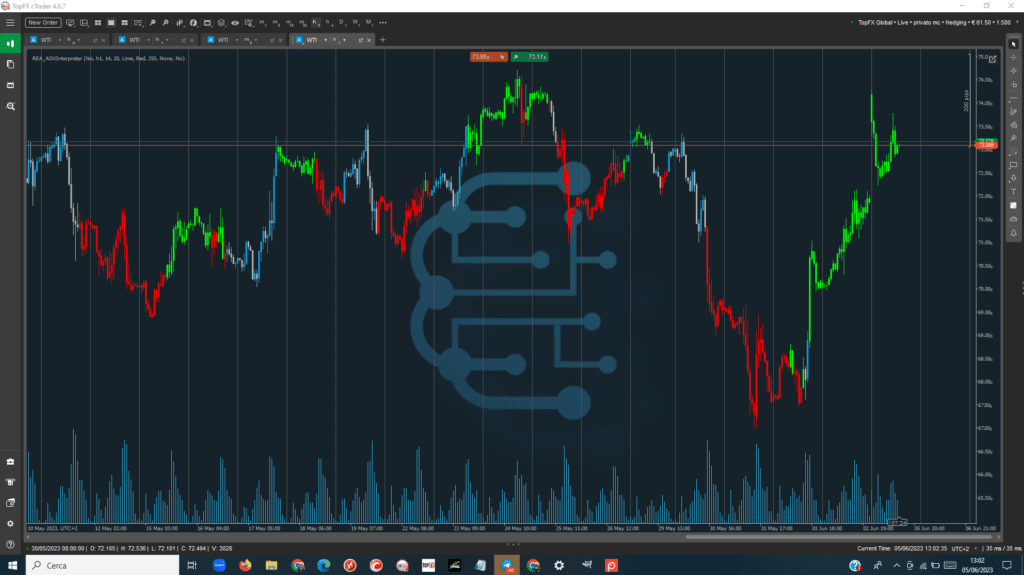
The +DI line represents the strength of a possible bullish trend in the graph, while the -DI line represents the strength of the opposite trend, i.e. bearish. The values that the ADX can assume start from the value 0, i.e. total absence of trend, to reach a maximum directional push at the value 100. Values over 60 are very rare cases and must be carefully evaluated: they may be unrepeatable trading opportunities or , most commonly, indicator setting errors. Values between 0-25 indicate a lateral phase of the analyzed financial market from which more experienced investors usually stay away. If the indicator line crosses the Zero Line (which in this case is set at 25), it is a clear signal that the trend is taking a very specific direction. More precisely, values between 25 and 40 are the best time to look for entry points of a new trend. Values above 40 indicate the presence of a very strong trend underway which leaves no room for any trend reversals. These two algorithms, combined with the Average Directional Index, are used to generate buy and sell signals based on crossovers between lines. When the +DI indicator is above the -DI indicator, it shows that Long traders, the “bulls”, have the price trend in their favor. On the contrary, when -DI is higher than +DI, the advantage is in the hands of traders with short positions, i.e. the "bears". It is important to understand that the ADX indicator shows the trend and its strength, not the direction the chart will take. The direction of the trend is instead determined by observing the other two indicators, which as can be deduced from their names +DI and -DI.


